


Munters Group (OM:MTRS) Earnings Put Fair Value Back In Focus
Quarterly earnings put Munters Group in focus
Munters Group (OM:MTRS) just released third quarter and nine month results, reporting higher sales, net income, and earnings per share compared with the same periods a year earlier.
Munters Group’s recent earnings release has arrived alongside a sharp share price rebound, with the stock up 3.96% on the day and a 7 day share price return of 4.40%. However, the 90 day share price return is down 16.78% and the year to date share price return is down 29.44%, while the 5 year total shareholder return of 114.06% points to a much stronger longer term record.
Scan Munters Group’s peers riding similar earnings momentum by reviewing the hand picked 195 high quality undervalued stocks, which combine solid fundamentals with discounted valuations.
Given Munters Group’s stronger recent earnings against a weaker year to date share price, you need to judge whether this rebound tracks business performance or just a short term swing in sentiment as the valuation picture comes next.
Most Popular Narrative: 34% Undervalued
Munters Group’s most followed narrative points to a fair value of SEK206.25 per share, compared with the latest close at SEK136.40. The current rebound is still framed as leaving a wide valuation gap on narrative assumptions using a 7.3% discount rate.
Acceleration in demand for data centers and cloud infrastructure, now supported by around SEK 15b of Data Center Technologies backlog with deliveries extending into 2028 and at least 30% guided organic net sales growth in 2026, gives Munters Group multi year visibility that can support revenue and earnings.
See why 10 investors see Munters Group as 34% undervalued.
Result: Fair Value of SEK206.25 (UNDERVALUED)
Still, the thesis around Munters Group weakens quickly if supply chain bottlenecks drag out backlog conversion or if elevated leverage restricts spending just as data center demand is expected to scale.
Find out about the key risks to this Munters Group narrative.
Another View: Munters Group on Earnings Multiples
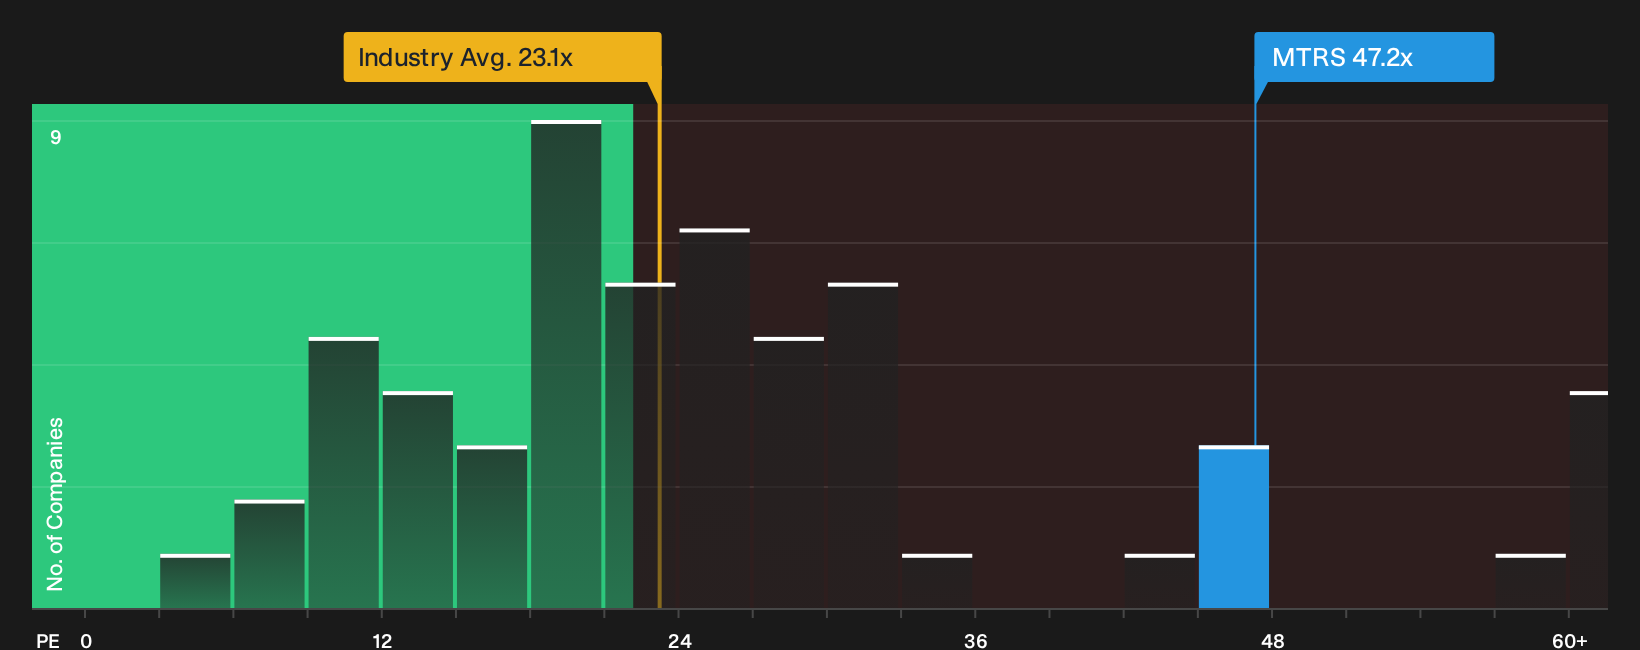
The SWS DCF model points to Munters Group trading at a discount to estimated future cash flows, yet the current P/E ratio of 47.2x sits well above both the European Building industry at 23.1x and peers at 24.3x. That gap signals valuation risk unless earnings grow into the price, or the fair ratio of 73.7x is where the market eventually leans.
Before leaning on either story too heavily, it helps to see how the numbers are built and what would need to change for this premium to feel comfortable or stretched in your own framework. See what the numbers say about this price — find out in our valuation breakdown.
Next Steps
Mixed signals around Munters Group can be confusing. Move quickly, review the full set of data, and decide whether the balance of upside and downside fits your own risk tolerance by weighing the 3 key rewards and 1 important warning sign.
Looking for more investment ideas beyond Munters Group?
If Munters Group has your attention, do not stop there. Broaden your watchlist now so you are not relying on a single story.
- Target resilient balance sheets by scanning a list of solid balance sheet and fundamentals (207 results) that filters for robust financial footing and healthier fundamentals.
- Hunt for quality at a discount through a curated 610 high quality undiscovered gems that highlights companies with strong metrics yet limited market attention.
- Prioritise stability and capital protection by reviewing a 223 resilient stocks with low risk scores that emphasises businesses with lower risk scores and steadier profiles.
Have feedback on this article? Concerned about the content? Get in touch with us directly. Alternatively, email editorial-team@simplywallst.com