


3 Undervalued Stocks Trading Up To 47% Below Fair Value
AI stocks have soaked up attention, yet concern is building that heavy debt and fragile business models could leave many of them exposed. That kind of boom risk creates opportunity in a quieter corner of the market: solid businesses throwing off cash but priced as if they are nothing special. This article walks through three such ideas flagged by a discounted cash flow screen and explains why their current pricing may appeal to patient value hunters.
The stocks highlighted below are only a small sample, with the same DCF screen surfacing 461 more businesses whose cash flow profiles and prices tell similarly interesting stories. To see the full Undervalued Stocks Based On Cash Flows list and quickly identify which ones fit your own checklist, head straight into the Undervalued Stocks Based On Cash Flows screener.
L.D.C (ENXTPA:LOUP)
Overview: L.D.C is a France based food group that raises poultry, runs abattoirs and feed mills, and sells branded convenience meals.
Operations: L.D.C generates about €4.8b from Poultry, €1.2b from Processor activities and €1.4b from Abroad, mostly across France and Poland.
Market Cap: €3.6b
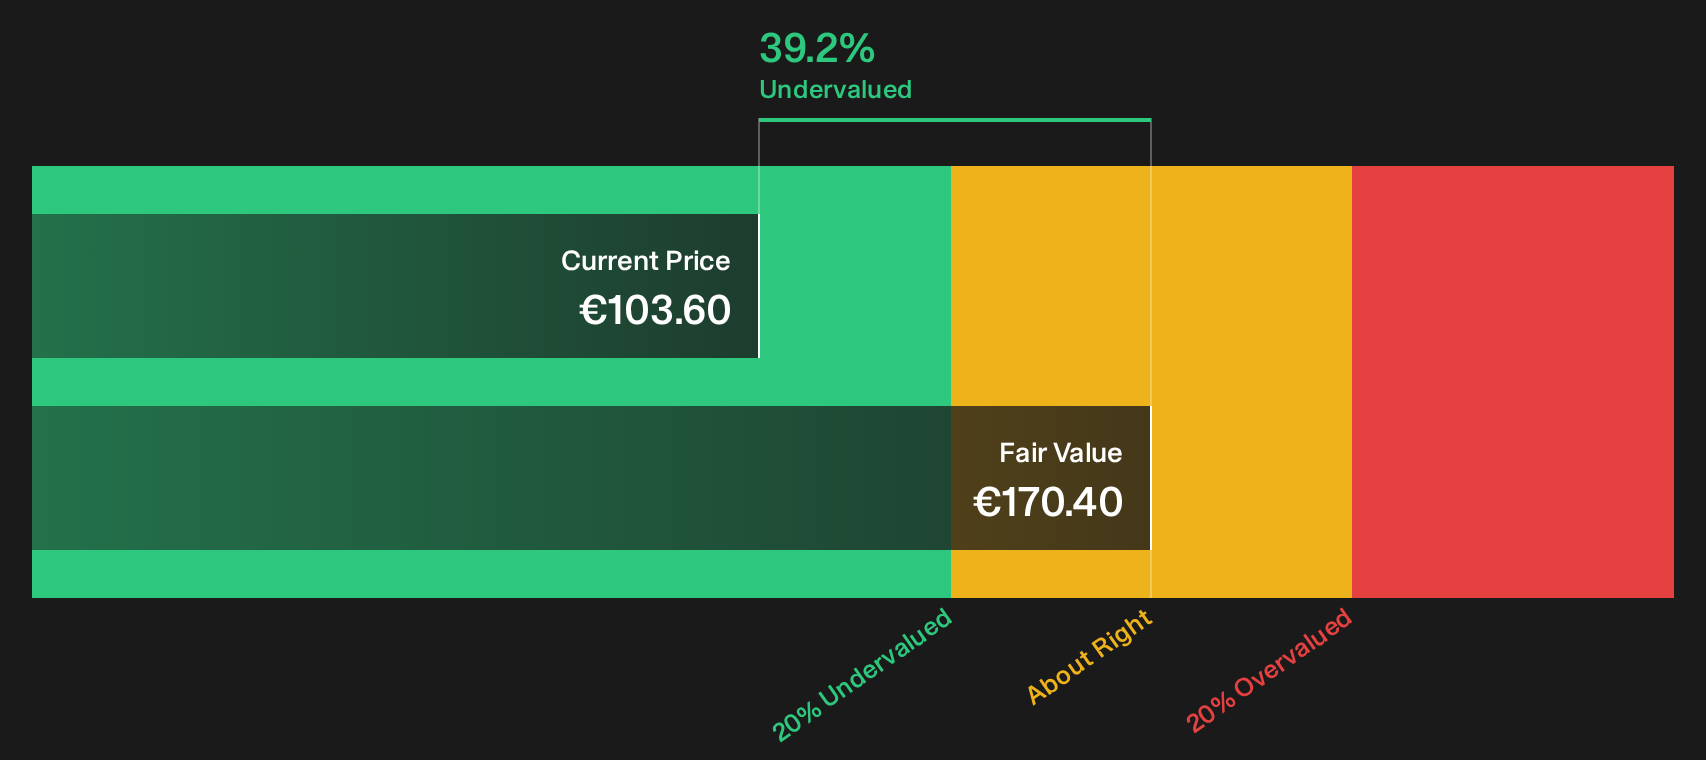
L.D.C fits this cash flow focused screen, as its poultry and prepared food activities support steady earnings and a DCF value estimated at around 39% above the current share price, based on an 11.2x P/E and an improving 4.4% net margin. However, the outcome ultimately depends on how pressure on those margins is resolved.
With those margins in play, review the 5 key rewards and 1 important warning sign to see how L.D.C’s valuation and cash generation line up against that pressure.
Protector Forsikring (OB:PROT)
Overview: Protector Forsikring is a Norway based non life insurer that earns recurring premiums from personal, motor, property and liability policies across Northern Europe.
Operations: Protector Forsikring generates about NOK 15.2b in revenue from property and casualty insurance, which underpins the cash flow focused DCF valuation signal.
Market Cap: NOK 36.9b
Protector Forsikring matters for this cash flow screen because its non life underwriting engine produces recurring premiums that directly feed the DCF view on value.
"Protector Forsikring continues to build out its data and AI tools across underwriting, claims and support functions, with management accepting higher current costs in order to raise decision accuracy and make the cost base more scalable. This is aimed at supporting net margins and earnings."
The real test for Protector Forsikring now is how one unseen pressure on future pricing and claims ends up shaping those margins.
That pricing unknown sits at the centre of the full narrative for Protector Forsikring, which describes how Protector Forsikring’s underwriting model could accelerate or stall as conditions shift.

DEME Group (ENXTBR:DEME)
Overview: DEME Group provides offshore wind construction, dredging, marine infrastructure, environmental remediation and concessions that support long term marine and energy projects.
Operations: DEME generates about €2.2b from Offshore Energy and €2.0b from Dredging & Infra, with smaller contributions from Environmental and Concessions activities.
Market Cap: €4.2b
DEME Group matters for this cash flow focused list because its offshore wind construction and maintenance work is tied to long running contracts that can keep cash coming in long after each project starts.
"Free cash flow over five years reads +131, −80, +62, +729, −394 million euro. Unsmoothened, that is what a project-based marine contractor with a fleet to maintain looks like."
The real investor question is what happens to those contract backed earnings if a single key assumption about future returns or funding costs breaks.
If that assumption is what worries you, read the full narrative for DEME Group to see how DEME Group’s project swings could be masking a stronger long term earnings engine.

Seeking Alternatives Before Everyone Else?
Fresh ideas can move fast, and the strongest stories often gain momentum while most investors are still watching from the sidelines. Catch what others miss while it matters and consider acting early.
- Spot dependable income plays early and scan 224 dividend fortresses that could help keep portfolios grounded when sentiment shifts and payouts suddenly look more attractive.
- Track the next wave of automation and review 94 robotics and automation stocks where industrial efficiency, logistics and manufacturing upgrades may already be quietly gaining traction.
- Explore infrastructure upgrades and inspect 42 power grid technology and infrastructure stocks before spending cycles and regulatory discussions bring these grid technology stories into wider focus.
Have feedback on this article? Concerned about the content? Get in touch with us directly. Alternatively, email editorial-team@simplywallst.com