


Toho (TSE:9602) Looks Fully Valued As Raised Guidance Hinges On Securities Sale
Toho raises earnings guidance after investment securities sale
Toho (TSE:9602) moved into focus after management raised full year profit guidance for the fiscal year ending February 2027, citing higher profit attributable to owners of parent resulting from a partial sale of investment securities.
Recent trading shows momentum building, with Toho’s 1-day share price return of 3.52% adding to a 7-day move of 6.31% and a 90-day gain of 13.20%. At the same time, the 3-year total shareholder return of 82.32% contrasts with a slight 1-year decline of 1.08% once dividends are included.
Scan how Toho compares with a curated group of media and entertainment players showing strong momentum and solid fundamentals by running the list of solid balance sheet and fundamentals (23 results) as a starting universe.
For Toho, the recent jump follows an earnings upgrade driven by selling investment securities rather than a change in day to day trading conditions. So how much of the current share price reflects that one off boost versus the underlying business?
Price-to-Earnings of 37.7x: Is Toho’s premium justified?
Valuation is where Toho starts to look stretched, with the shares trading on a P/E of 37.7x, which is higher than several reference points investors often watch.
The P/E ratio compares the current share price to earnings per share. For a content producer and rights holder like Toho, it reflects what the market is willing to pay today for each unit of current profit, given expectations for future earnings, cash generation, and the resilience of film, IP, and real estate income streams.
At 37.7x earnings, the stock is priced well above the estimated fair P/E of 26x that Simply Wall St’s model suggests could be a more grounded level for its fundamentals. It is also above the peer average P/E of 35.2x and significantly above the wider JP Entertainment industry at 16.9x. That signals investors are already paying a clear premium for Toho’s earnings profile relative to both direct peers and the sector benchmark.
Explore the SWS fair ratio for Toho.
Result: Price-to-Earnings of 37.7x (OVERVALUED)
Still, earnings that rely on one-off security sales, along with a P/E premium over both peers and the wider JP Entertainment group, leave Toho exposed if sentiment cools.
Find out about the key risks to this Toho narrative.
Another view on Toho’s valuation
The P/E story already looks full, yet the SWS DCF model points to a different picture. At ¥1,736.5, Toho trades above an estimated future cash flow value of ¥1,143.89, which implies the shares screen as overvalued using that second lens. So which signal should carry more weight for you?
Before leaning on either metric too heavily, it is worth understanding how sensitive our DCF model can be to small shifts in cash flow assumptions and discount rates, and why that can matter a lot for a content heavy business like Toho. Look into how the SWS DCF model arrives at its fair value.
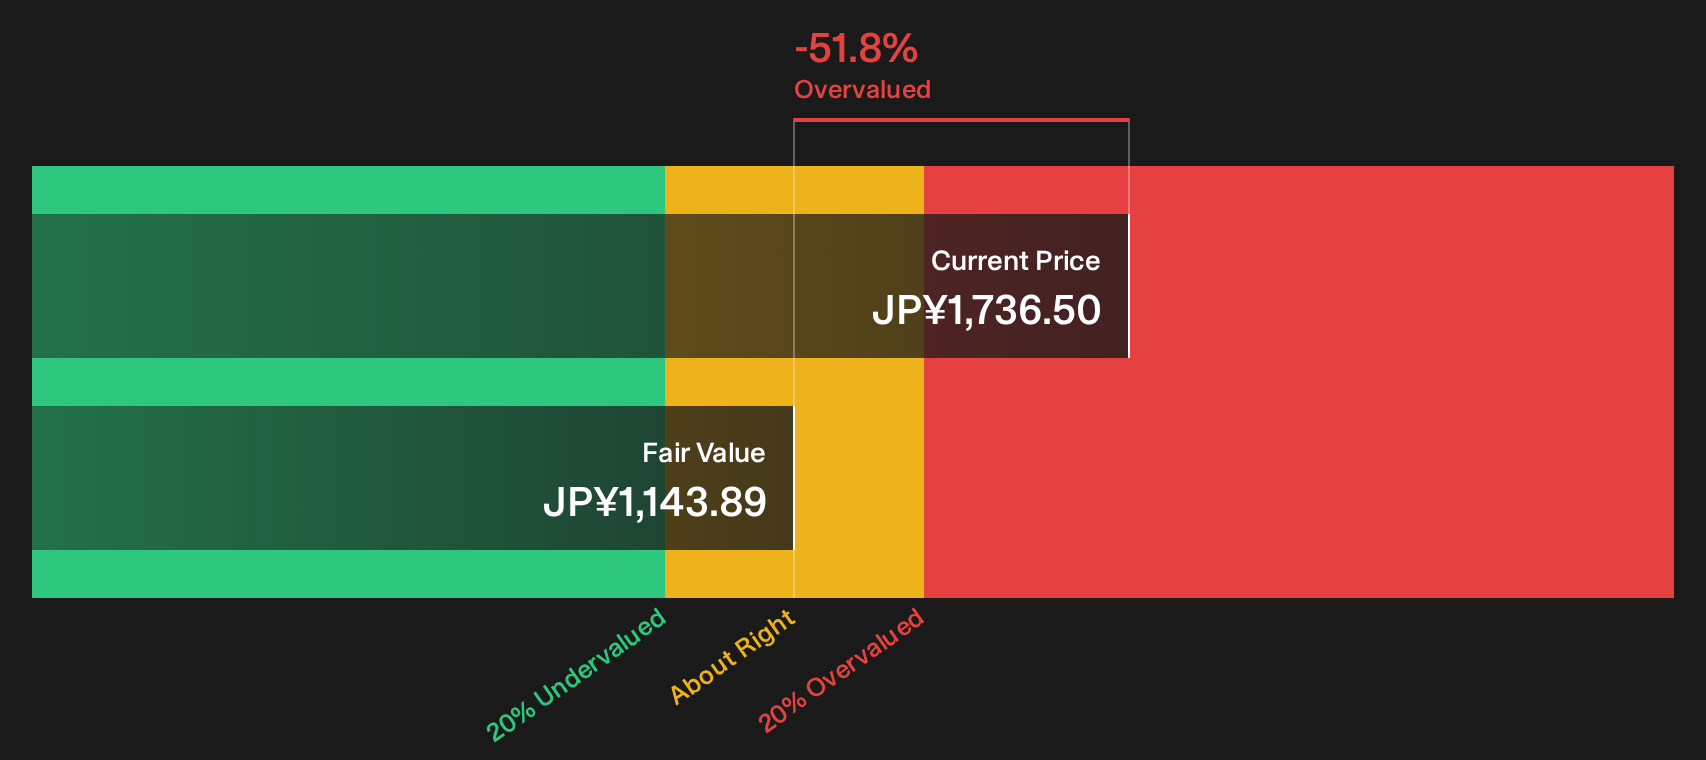
Simply Wall St performs a discounted cash flow (DCF) on every stock in the world every day (check out Toho for example). We show the entire calculation in full. You can track the result in your watchlist or portfolio and be alerted when this changes, or use our stock screener to discover 16 high quality undervalued stocks. If you save a screener we even alert you when new companies match - so you never miss a potential opportunity.
Next Steps
If the tone so far feels cautious rather than euphoric, that is intentional. It is exactly why you should move quickly and stress test the numbers yourself against the 1 key reward.
Looking for more investment ideas beyond Toho?
If Toho feels fully priced, broaden the watchlist. Fresh opportunities often sit just outside the obvious tickers, waiting for investors prepared to look wider.
- Target resilient compounding potential by using the 16 high quality undervalued stocks that filters for quality businesses trading below what their fundamentals may justify.
- Prioritise strength and staying power by scanning a list of solid balance sheet and fundamentals (23 results) that highlights companies with healthier finances and cleaner balance sheets.
- Hunt for tomorrow’s quiet overachievers through a 72 high quality undiscovered gems that surfaces underfollowed stocks with robust underlying metrics.
Have feedback on this article? Concerned about the content? Get in touch with us directly. Alternatively, email editorial-team@simplywallst.com