


Damo raised America's AI power gap: NVDA.US (NVDA.US) became the first choice for semiconductors under the “power shortage bottleneck” by naming the “shortening the electrification cycle” power plant
The Zhitong Finance App learned that in a research report released on October 26, Morgan Stanley raised the net electricity gap for US data centers to 38 GW from 2026 to 28, compared to 33 GW previously. Meanwhile, Damo pointed out that ASICs or GPUs lost their share in the power gap.
The trigger for this round of updates is that investors are trying to reconcile capital expenditure expectations of $1.5 trillion in 2027 and $1.6 trillion in 2028 with electricity availability. Morgan Stanley said bluntly that about one-third of the electricity gap is not a market consensus — many investors believe that companies will “creatively find ways to get around the bottleneck,” citing that supply chain orders are still strong as proof.
The bank's position is unwavering: it is still convinced that the electricity gap is real and is a key constraint on construction. It acknowledged that there were three levers that could narrow the gap—power behind the meter, outflow to Asia, grid optimization, and data center peak—but each faced its own constraints; at the same time, it defended its Vera Rubin rack power hypothesis.
How is 38GW calculated?
The gap in the research report is not a number; it is three levels.
The first level is the “pre-solution gap”: the US data center electricity demand for 2026-28 is 116 GW (previously 97 GW); after deducting 25 GW of the computer room in front and behind the meter under construction, and 21 GW of usable front-table grid capacity, the gap is 70 GW (previously 57 GW).
The second level is the “net gap in the mainland of the United States”: after including five “shortening the electrification cycle” plan, the study presented three levels: low/medium/high - additional rear-table turbines and engines (6/22/38GW), Bloom Energy fuel cells (5/6/8GW), building a data center (1/3/8GW) at the same site as operating nuclear power plants, transforming existing electric power plant sites (11/19/27GW), and US demand spilled into the Asia-Pacific region (5/6/8 GW). The probability-weighted net gap was 60/43/23GW, accounting for 52%/38%/20% of demand.
The third tier is the “net gap with global solutions”: when the Asia-Pacific spillover is taken into account, it is 56/38/17GW, accounting for 48%/33%/14% of demand. The study notes “We think this is the most likely outcome” in the median range — that is, 43 GW (38%) in the continental US, or 38 GW (33%) including the global solution. This is the point of this increase.
Why did demand jump from 97 GW to 116 GW?
Three model revisions have boosted demand: first, an increase in the expected utility power required to power all purchased chips, adding energy consumption for energy storage, networks, and other rack-level components — which were not previously included; second, an increase in total power demand from historical non-generative AI data centers; and third, a 75% load factor was correctly included in the power methodology, increasing the total electricity required for the chip to operate at full load.
The research report also emphasizes the need to clarify the three levels of electricity — total electricity (total amount delivered by the power grid), critical IT electricity (the portion delivered to the chip after PUE conversion), and used electricity (actual “consumption” of the chip, including load factor) — and correctly convert between the various details to arrive at total demand. The increase was partially offset by more pre-meter grid capacity (from 15 GW to 20 GW in 2026-28) and post-meter plans, but the net result is still a widening gap.
There are five ways to fill the gap, but there is an upper limit on recruitment
It is worth noting that the research report gave each tender a chance of success: 90% of the turbines and engines after the additional table, 90% of Bloom Energy fuel cells, 70% of operating nuclear power plants at the same site, 85% of existing power plant sites, and 90% spillover into the Asia-Pacific region.
The probability is not low, but no single trick can fill 70 GW alone. Even in the median range, the five items were superimposed, leaving 43 GW. The report's subtext is clear: the gap can be reduced, but it cannot be eliminated.
The ceiling of the power supply behind the meter is labor, not production capacity
Morgan Stanley's benchmark situation predicts the 2026-28 launch of the 31 GW meter plan, taking the average of “signed contracts” and “total possible production capacity”; the research report admits that if the total production capacity of turbines, etc. is measured, the gap can be further narrowed.
But the bottleneck soon turned to labor. The utility team believes that the current labor base can only support about 10-20 GW of new gas per year (including the back of the meter and both sides of the grid); however, by the end of this year, this figure may rise to more than 50 GW per year. In other words, the power supply behind the watch is not “as many as you want to build,” but is limited by how many people can install it.
There is electricity in Asia, but it may not be possible to connect
The second question points to spillover. The research report estimates an overflow of 6 GW from 2026-28; through communication with the company, the Asian team anticipates that about 15 GW of US hyperscale demand may spill over to Asia by 2030, with another 3 GW coming from newly built fabs in ASEAN, India, and South Korea.
Split by region: Malaysia 4.0GW, other ASEAN 4.0GW, India and others 3.4GW, Australia 2.0GW, Japan 1.5GW. Thailand, India, and Japan attract the strongest data center commitments, and Thailand is also benefiting from the demand of Chinese hyperscale manufacturers. In total, these markets have about 30GW of surplus electricity capacity, which comes from a rise in gas, coal, and nuclear power production capacity — but the research report also indicates that power grid restrictions have limited recent serviceability. Having electricity doesn't mean you can connect to it.
Power grid optimization and peak cutting: Theoretical progress, limited by reality
Clause 3 is the most technical question, and Morgan Stanley's rebuttal is also the least relentless.
Grid enhancement technology (software and hardware that makes grids more “smart”) is indeed a path to increase existing line capacity with lower capital expenses, but the key constraint is whether utility companies are willing or unwilling to invest. Data center peak cutting (promises to use less grid power during peak electricity consumption) can theoretically ease grid pressure, but the research suggests that utilities will not increase the grid-connected capacity of data centers as a result — because they manage the grid under the most extreme conditions, and demand response lasts far less than the extreme events they have planned. The research report gave a very specific example: when winter storms are accompanied by alternating power outages, data centers are unlikely to run diesel generators for six consecutive days, not to mention that they are subject to state and local emission limits for pollutants and particulate matter. Furthermore, the US has done little to no regulatory action to achieve this result.
Key: How many kilowatts does Vera Rubin actually have?
Morgan Stanley raised the Vera Rubin rack power from 149 kW to 234 kW and Rubin Ultra from 415 kW to 600 kW in September. It received a lot of feedback, and this time it was a special response.
The calculation logic is: Vera Rubin NVL72 assumes a single GPU thermal design power consumption of 2,300 W, 72 GPUs total 165.6 kW, plus 68.4 kW for CPU, network, and other rack components; Rubin Ultra uses the 600 kW caliber proposed by Nvidia in GTC 2025.
Four reference systems support this number: Nvidia's own roadmap (reaffirmed at the OCP summit last week) marks the NVL72 at about 240kW; Nvidia also cites 330kW as the power capacity supported by its 110kW power rack, not the expected power consumption of the NVL72; the MGX 1.2 architecture supports up to 250kW; in terms of supply chain, Schneider Electric gave 227-246kW, Vertiv about 240—250kW, TrendForce about 225kW, and Asus for it NVL72 Max-P specified 228 kW.
The research report also mentioned three types of engineering improvements worth noting, but the model does not currently reflect its potential benefits: Nvidia's MaxLPS (allocates power to GPUs as needed), rack intelligent power smoothing (using energy storage and GPU-level control to reduce power spikes), and 800VDC power distribution. Regarding the Rubin Ultra, the research report admits that due to the cancellation of the original Kyber rack design and replacement with a new architecture, the final configuration is still evolving, and there is greater uncertainty.
Who benefits?
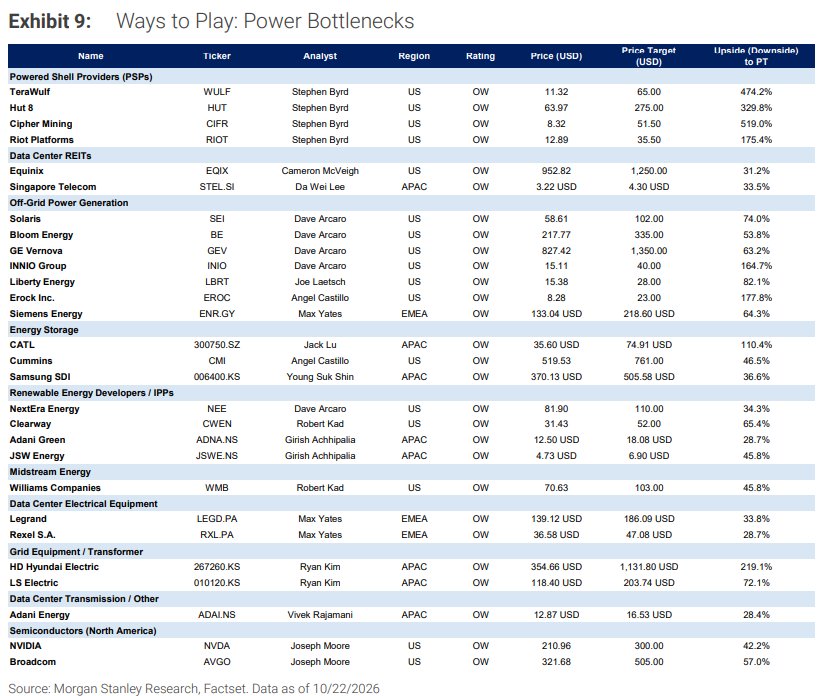
According to the research report, the gap will increase the urgency and premium of two types of targets: the first is the US “shortening the electrification cycle” plan — post-list suppliers Bloom Energy (BE.US), Solaris (SEI.US), and the installed power plant suppliers TeraWulf (WULF.US), Hut 8 (HUT.US), Cipher Mining (CIFR.US), and Riot Platforms (RIOT.US); the second is data center growth outside the US.
In terms of semiconductors, Nvidia (NVDA.US) and Broadcom (AVGO.US) are still the most optimistic, due to conservative guidance, visibility of chip delivery, regional expansion outside the US, and Nvidia's higher token output per watt. If construction is suspended, disturbances are most likely to occur at the end of the “bullwhip effect” — that is, where shortages drive pricing to support revenue and profits, such as downstream components such as storage and optical modules, and power management and simulation devices that may be overordered in a bear market situation. The report also suggests that in an environment with limited power, ASIC may lose share compared to GPUs due to its lower token output per watt and weaker cross-customer fungibility.
The logic on the cost side is: while the total cost of a data center rises from generation to generation, the unit cost falls even faster—from about $14.30 per TFLOPS of data center cost per TFLOPS to about $0.88 for Rubin Ultra. Based on this, the research report believes that even if there is a gap, companies are still motivated to adopt a plan to shorten the electrification cycle.
It should be clarified that the report disclosure page shows that Morgan Stanley stated that it has business dealings with the covered companies and that there may be a conflict of interest; as of September 30, 2026, it holds more than 1% of common shares in many companies including Nvidia, Broadcom, Bloom Energy, GE Vernova, TeraWolf, Solaris, etc.; it has been Nvidia, Broadcom, Bloom Energy, GE Vernova, TeraWolf, Solaris, etc. Companies such as Equinix and NextEra manage or jointly manage public offerings and receive investment banking service rewards from multiple companies; in addition, many signed analysts and researchers themselves hold shares of the companies mentioned in this report.