


Does Earnings Beat Change The Bull Case For Reliance Stock (RS)?
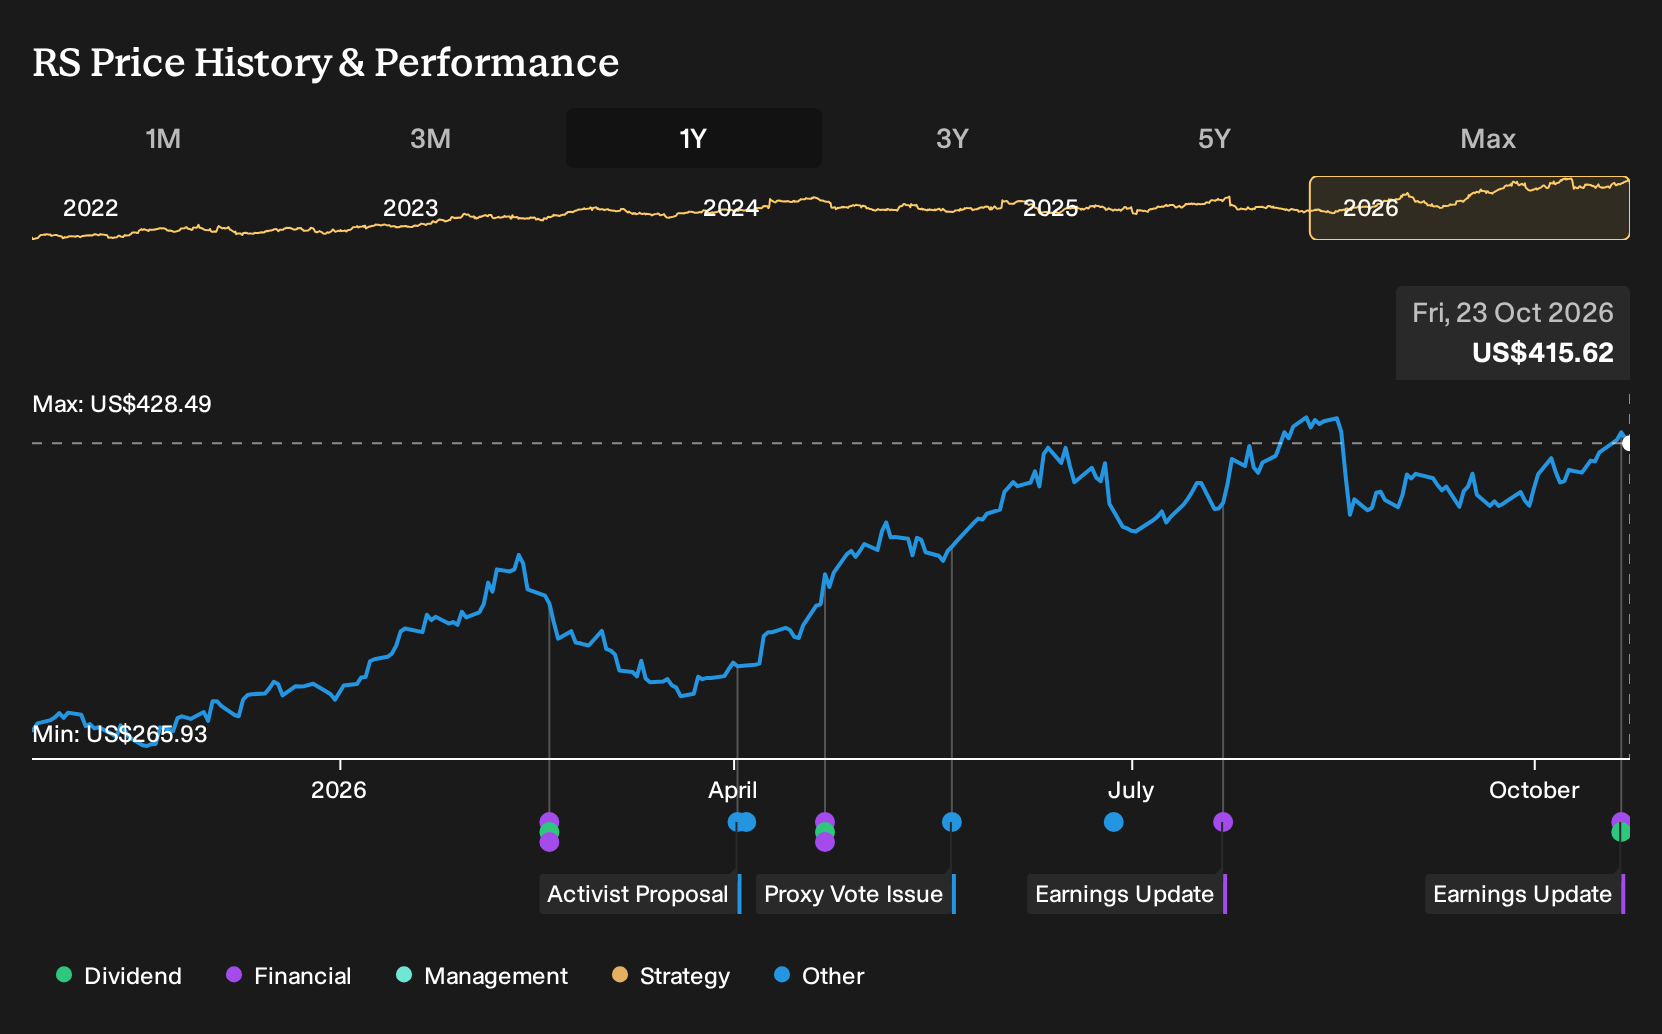
- Reliance, Inc. reported third quarter 2026 sales of US$5,213.2 million and net income of US$402.9 million, with basic earnings per share from continuing operations of US$7.90, and declared a quarterly cash dividend of US$1.25 per share payable in December 2026.
- The combination of higher reported earnings, stronger earnings per share and the ongoing cash dividend indicates that Reliance is balancing reinvestment needs with consistent cash returns to shareholders based on current operating performance.
- The focus now turns to how Reliance's stronger earnings per share may reshape the existing investment narrative that centers on resilient infrastructure demand.
Scan how Reliance's earnings momentum and dividend policy compare with other metal and infrastructure focused businesses by running through the hand picked list of solid balance sheet and fundamentals (24 results).
Reliance Investment Narrative Recap
To stay invested in Reliance, you need to be comfortable with a metals solutions business that is tightly linked to non residential construction, data centers, infrastructure and government work, while also managing exposure to metal price and tariff noise. The big near term swing factor is how long current shipment strength and processing demand hold up against any customer caution tied to trade policy.
The main risk right now sits in input costs and accounting charges, not demand headlines. Higher aluminum and carbon prices, plus raised 2026 LIFO expense guidance, already point to pressure on reported margins if metal pricing stays volatile. The latest earnings beat does not fully remove that concern.
The third quarter 2026 report is the key update worth focusing on here. Reliance posted US$5,213.2 million of sales and US$402.9 million of net income for the quarter, with basic EPS from continuing operations of US$7.90. For the first nine months of 2026, revenue was US$13,869.2 million and net income reached US$990.7 million.
Those figures matter for your catalyst and risk checklist because they show current projects in infrastructure, government work and value added processing still flowing through the income statement despite tariff and LIFO headwinds. The question for you is how much of this earnings power feels repeatable if aluminum costs, tariffs or LIFO charges remain elevated.
What Analysts Are Baking Into The Reliance Story
Analysts are not sketching a high growth arc for Reliance. The consensus view points to revenue staying broadly flat over the next three years, with the firm moving from a 6.4% profit margin today to 6.3% by 2029.
Earnings today are pegged at about US$1.1b, which lines up with earnings per share of US$22.86. Forecasts keep that profit level essentially unchanged by 2029, so the implied earnings change from current consensus is minimal in both dollar terms and on a per share basis.
The bigger swing factor is not income growth but what investors are willing to pay for those profits. To hit the current analyst targets, Reliance would need to trade on a P/E of 23.3x those expected 2029 earnings, compared with a multiple of 19.3x today and a sector figure of 18.1x for US metals and mining peers.
The valuation framework in the stock research you scan is built on those inputs. It pairs an 8.95% discount rate with largely steady top line assumptions, slightly softer margins and shrinking share count, as analysts model a 2.57% yearly decline in outstanding shares over the next three years.
Reliance's narrative projects about US$17.5b of revenue and US$1.1b of earnings by 2029, with earnings today also around US$1.1b. This means the consensus setup leans on flat top line, flat profit and a higher P/E multiple rather than on a large earnings increase from current levels.
Uncover why Reliance's fair value is essentially in line with its current price.
Exploring Other Perspectives
Two fair value estimates from the Simply Wall St Community span roughly US$171 to US$419 per share, which is a wide gap for Reliance given both are based on pre earnings and pre dividend data. You can set those retail viewpoints against tariff and LIFO risks, or potential infrastructure and data center catalysts, to judge which scenarios feel more realistic and why other investors might disagree.
Explore another Reliance fair value estimate, including one that suggests as much as 59% downside from the current price.
Reach Your Own Conclusion
Disagree with existing narratives? Extraordinary investment returns rarely come from following the herd, so go with your instincts.
- A great starting point for your Reliance research is our analysis highlighting 2 important warning signs that could impact your investment decision.
- See our latest analysis for Reliance. The report includes a comprehensive fundamental analysis summarized in a single visual, the Snowflake, making it easy to evaluate Reliance's overall financial health at a glance.
Looking For More Ideas Beyond Reliance?
If Reliance has sharpened your thinking about earnings quality, balance sheets and payout habits, it can be useful to contrast it with other companies that share similar strengths or offer different risk profiles.
The Simply Wall St screener lets you quickly filter by the traits that matter most to you. A few starting points are:
- For investors who care most about staying power and financial resilience, start with a list of solid balance sheet and fundamentals (24 results) that meet strict balance sheet and fundamentals filters.
- If you are hunting for potential mispricings with quality still intact, scan a 28 high quality undervalued stocks that pair solid cash generation with more modest expectations.
- When you want to round out your watchlist with less volatile profiles, consider a 30 resilient stocks with low risk scores that screen well on Simply Wall St's risk scoring framework.
Have feedback on this article? Concerned about the content? Get in touch with us directly. Alternatively, email editorial-team@simplywallst.com