


GLP J-REIT (TSE:3281) Faces A Valuation Test On Buyback Earnings And Leadership Shift
Multiple moving parts hit GLP J-REIT (TSE:3281) on 15 October 2026. Investors saw a fresh unit buyback plan, half year earnings, new borrowing terms, dividend guidance tweaks and a leadership change announced together.
GLP J-REIT enters this cluster of announcements with its units at ¥129,700, after the share price fell 9.74% over the past 90 days and declined 12.84% year to date. The 3-year total shareholder return of 10.91% contrasts with a weaker 5-year total shareholder return of 11.97% and indicates that long term momentum has softened recently as investors reassess both growth prospects and risk around distribution guidance, capital structure moves and leadership change.
Scan how GLP J-REIT stacks up against other real estate plays by jumping over to a hand picked set of list of solid balance sheet and fundamentals (23 results)
GLP J-REIT still looks like a sizeable logistics platform on paper, even as the unit price has slipped and a buyback kicks in. Does that combination leave the trust attractively valued today, or already fully priced?
Preferred P/E of 20.3x for GLP J-REIT: Is it justified?
GLP J-REIT units closed at ¥129,700, and the trust currently trades on a P/E of 20.3x, which screens as expensive relative to several benchmarks and its own fair P/E estimate.
The P/E ratio compares the current unit price to earnings per unit and, for a logistics focused J-REIT like GLP J-REIT, it gives a quick read on how much investors are paying for each yen of profit from its warehouses and rental income.
On Simply Wall St's fair ratio work, a P/E of 20x is flagged as a rough equilibrium level for this REIT. The present 20.3x therefore implies the market is paying a premium to that reference point, even before considering factors like its one off ¥8.4b gain and modest 1.11% earnings growth outlook.
Compared with peers, the gap is wider. The same 20.3x P/E is higher than the 19.6x average for direct peers and above the 15.9x average across Asian industrial REITs, which points to investors applying a stronger earnings multiple to GLP J-REIT than to the broader group.
Explore the SWS fair ratio for GLP J-REIT.
Result: Price-to-Earnings of 20.3x (OVERVALUED)
Still, the story can change quickly if the ¥8.4b one off gain distorts earnings or if acquisition-driven growth in assets under management stalls.
Find out about the key risks to this GLP J-REIT narrative.
Another View on GLP J-REIT: Our DCF Model Weighs In
The SWS DCF model paints a different picture for GLP J-REIT. With units at ¥129,700 and an estimated future cash flow value of ¥93,356, the trust screens as overvalued on this lens. That gap suggests less room for error if cash flows do not track expectations.
For a closer look at the cash flow assumptions that sit behind this gap, and how sensitive they are to changes in growth or discount rates, Look into how the SWS DCF model arrives at its fair value.
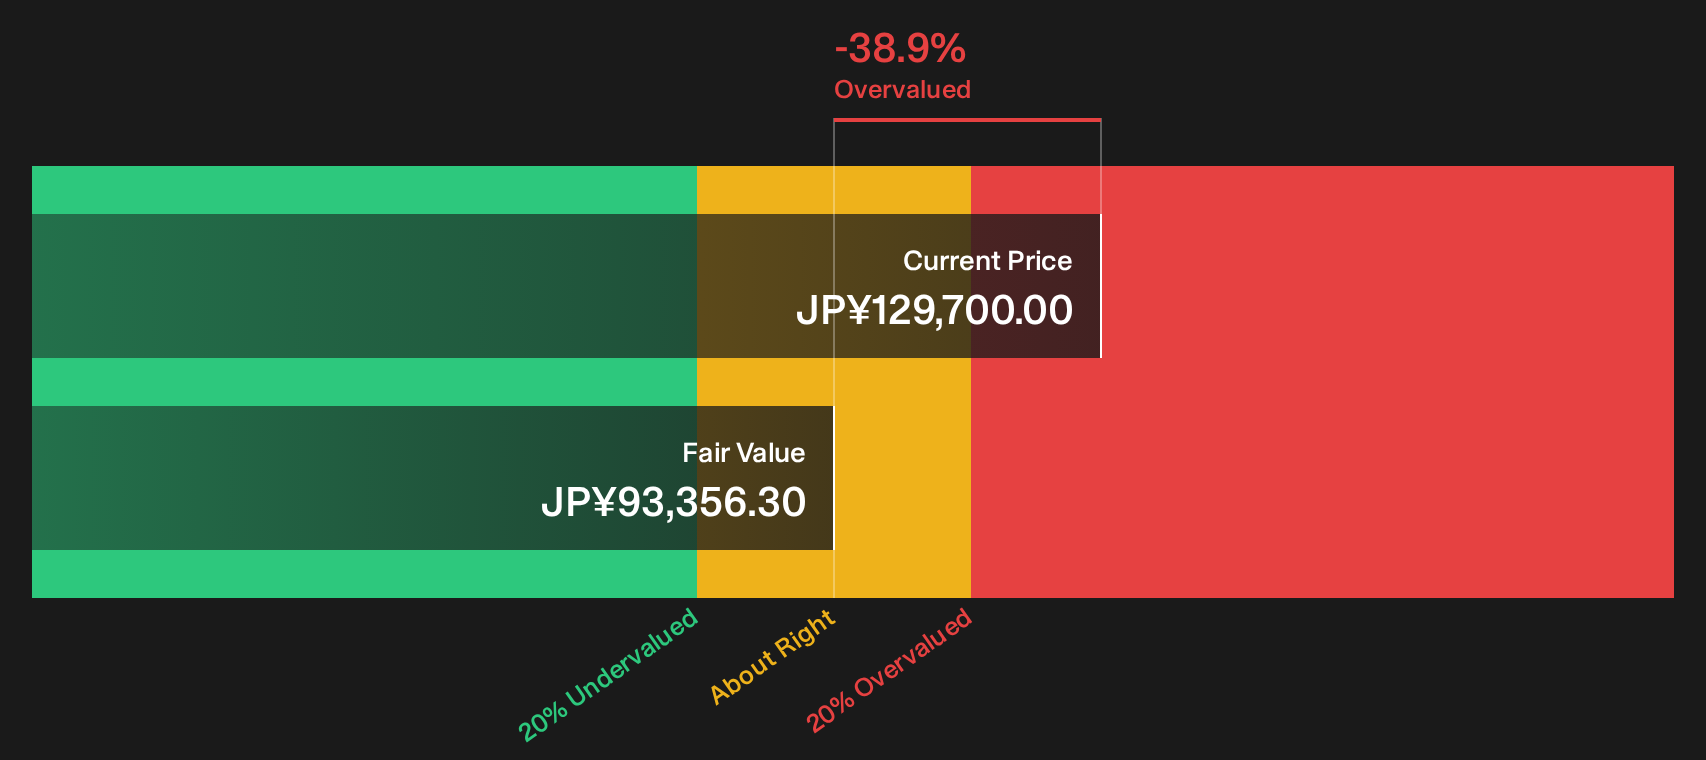
Simply Wall St performs a discounted cash flow (DCF) on every stock in the world every day (check out GLP J-REIT for example). We show the entire calculation in full. You can track the result in your watchlist or portfolio and be alerted when this changes, or use our stock screener to discover 14 high quality undervalued stocks. If you save a screener we even alert you when new companies match - so you never miss a potential opportunity.
Next Steps
Mixed signals around GLP J-REIT can make the picture feel messy, so move quickly with your own homework and weigh both sides of the story by reviewing the 2 key rewards and 3 important warning signs
Looking for more investment ideas beyond GLP J-REIT?
Do not stop your research with GLP J-REIT. Fresh ideas often come from scanning different sectors, yield profiles and balance sheet strengths side by side.
- Target predictable income by reviewing a hand picked set of 29 dividend fortresses built around higher yields and income focused fundamentals.
- Hunt for value opportunities by checking a curated group of 14 high quality undervalued stocks that combine quality fundamentals with discounted pricing signals.
- Prioritise capital protection by starting with a focused 22 resilient stocks with low risk scores that emphasises resilient financial profiles and lower risk scores.
Have feedback on this article? Concerned about the content? Get in touch with us directly. Alternatively, email editorial-team@simplywallst.com