


Is Aisin (TSE:7259) Undervalued As Its Share Price Slide Tests The Bull Case?
Recent share performance and what it signals for Aisin
Aisin (TSE:7259) has drawn fresh attention after a sustained slide in its share price over recent months, prompting investors to reassess what the current valuation implies for future expectations.
The stock is roughly flat over the past day, while returns over the past week, month and past 3 months have declined 2.6%, 4.0% and 7.0% respectively. Year to date, the share price is down 28.6%, with the 1 year total return declining 16.1%.
In contrast with that shorter term weakness, the longer view looks different. The 3 year total return is 29.2%, and over 5 years the stock has delivered 84.4% in total return, which gives important context for recent moves.
Aisin’s ¥2,144.5 share price comes after a year where the stock has lost ground in the near term while still showing much stronger total shareholder returns over the past several years.
Recent share price weakness, including the double digit decline in the year to date period, suggests that investors are either reassessing growth prospects or assigning a higher risk premium, even though the multiyear total shareholder returns point to a business that has rewarded patient holders over time.
Spot 14 high quality undervalued stocks that, like Aisin after its recent pullback, have come under pressure despite multi year total returns that still paint a very different picture.Aisin looks like a solid auto parts group with multi year gains still intact, yet the recent slide raises a sharper question. At ¥2,144.5 per share, is that strength already in the price or not?
Price-to-Earnings of 9.2x: Is it justified?
Aisin changes hands at a P/E of 9.2x, which, against the last close of ¥2,144.5, points to a valuation that looks restrained compared to peers on earnings power.
The P/E ratio compares the current share price to earnings per share and gives you a shorthand for how much investors are paying for each unit of profit. For a large auto parts group like Aisin, which operates across transmissions, eAxles, brakes and other components, this earnings yardstick is a common way investors benchmark against similar businesses.
Relative to its direct peer group, Aisin is described as good value based on its 9.2x P/E compared to a peer average of 22.7x. This suggests the market is attaching a lower earnings multiple than many comparable stocks. Against the wider JP Auto Components industry though, it is described as expensive at 9.2x versus an industry average of 9.2x. This effectively signals that the sector as a whole could be the reference point the multiple may move towards rather than away from over time. The fair P/E estimate of 13.4x is also clearly higher than the current 9.2x level. This gap signals the market is pricing Aisin at a discount to where the regression based fair ratio suggests it could trade.
Explore the SWS fair ratio for Aisin.
Result: Preferred multiple of Price-to-Earnings of 9.2x (UNDERVALUED)
Still, Aisin faces clear risks if auto demand softens or if its broad product range, from transmissions to eAxles, requires heavier investment that pressures earnings.
Find out about the key risks to this Aisin narrative.
Another view on Aisin using cash flows
The earnings multiple paints Aisin as restrained on price, yet the SWS DCF model points in a different direction. On that cash flow view, the stock at ¥2,144.5 is described as trading below an estimated value of ¥5,381.78, which frames the current price as a much steeper discount. Which lens do you trust more when the signals diverge this far?
Look into how the SWS DCF model arrives at its fair value.
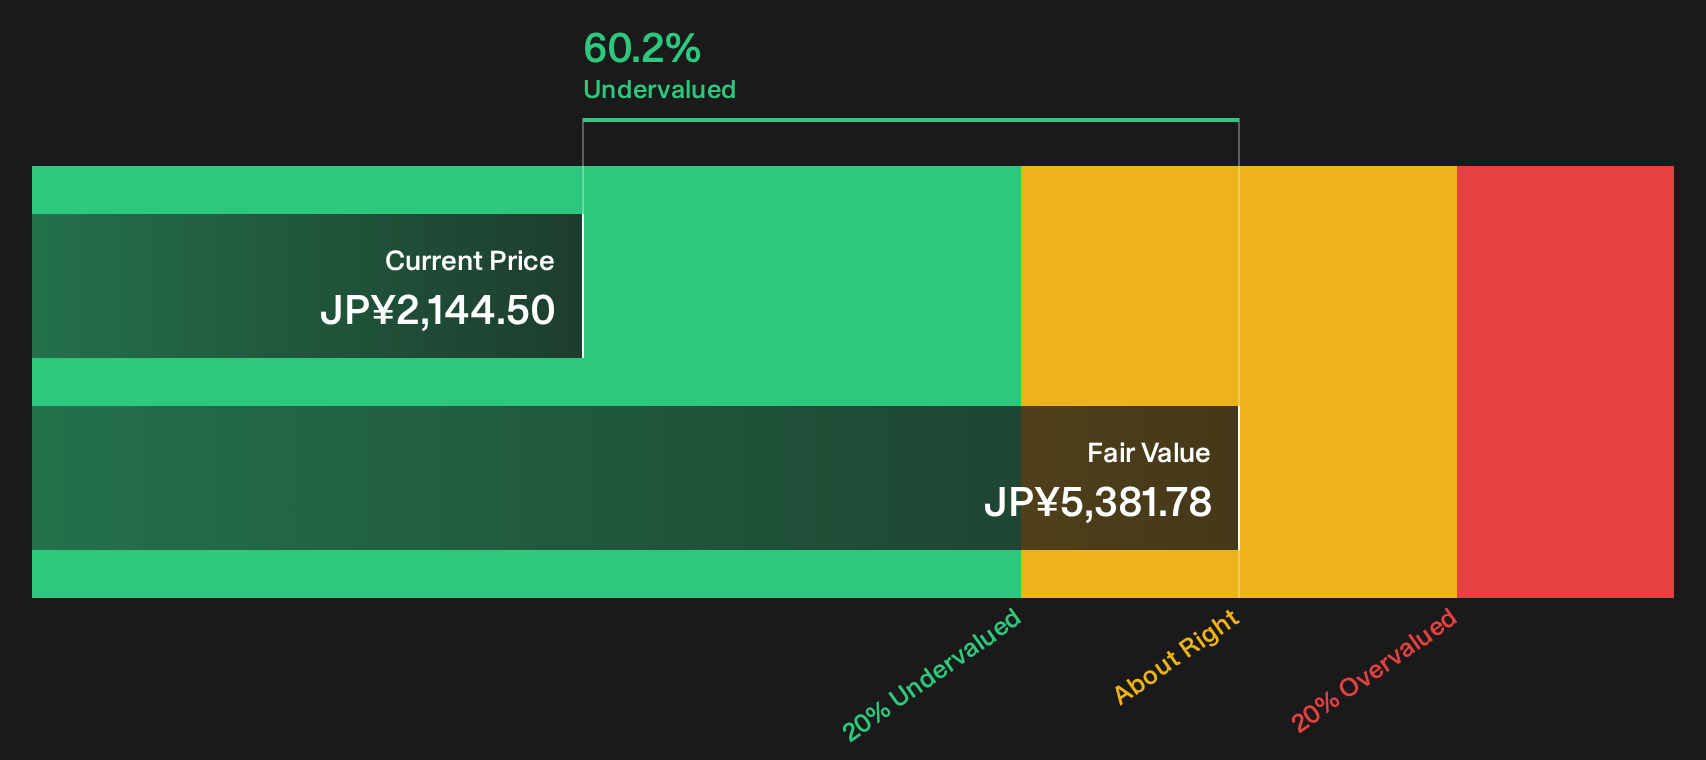
Simply Wall St performs a discounted cash flow (DCF) on every stock in the world every day (check out Aisin for example). We show the entire calculation in full. You can track the result in your watchlist or portfolio and be alerted when this changes, or use our stock screener to discover 14 high quality undervalued stocks. If you save a screener we even alert you when new companies match - so you never miss a potential opportunity.
Next Steps
Sentiment on Aisin is clearly mixed, with pressure on the share price but a longer record that still looks constructive. If you want to move quickly and ground your own view in the underlying data, start by weighing both the upside and the risk signals highlighted in the 3 key rewards and 1 important warning sign.
Looking for more ideas beyond Aisin?
If Aisin has sharpened your thinking on valuation and risk, do not stop here. The next opportunity could sit just outside your current watchlist.
- Target resilient compounding potential by focusing on businesses flagged as having strong fundamentals and a solid financial base through our list of solid balance sheet and fundamentals (23 results).
- Hunt for mispriced quality by scanning companies that screen as attractively valued relative to their fundamentals using the 14 high quality undervalued stocks.
- Lock in income-focused ideas by reviewing dependable cash return candidates highlighted in the 29 dividend fortresses.
Have feedback on this article? Concerned about the content? Get in touch with us directly. Alternatively, email editorial-team@simplywallst.com