


Does Pacific Integration Progress Change The Bull Case For Banner (BANR)?
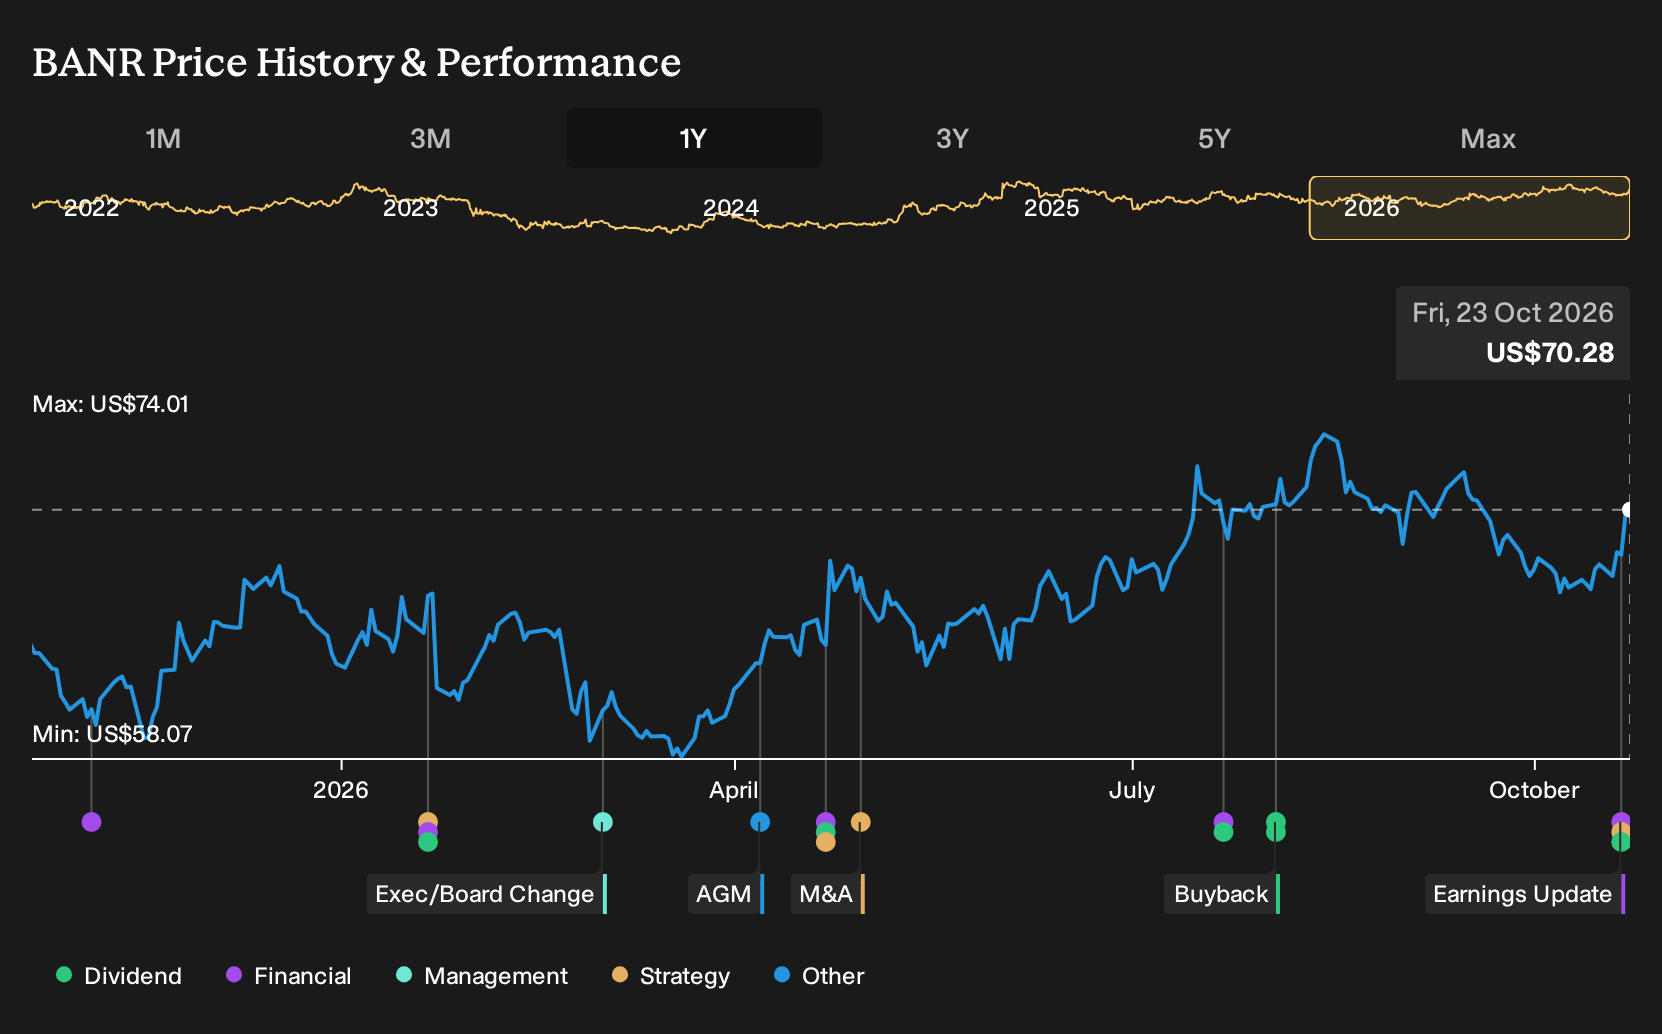
- Banner Corporation reported Q3 2026 results that included US$161.89 million in net interest income, US$47.71 million in net income, and affirmed a regular quarterly dividend of US$0.52 per share payable in November 2026.
- The update showed higher net interest income, lower net charge offs of US$704,000 for the quarter, and ongoing integration of Pacific Financial, alongside organic loan growth in commercial real estate and construction lending.
- We will now look at how Banner's investment narrative is affected by Q3 earnings and the Pacific Financial integration progress.
Compare Banner's Q3 story with a hand picked 30 resilient stocks with low risk scores that also emphasizes balance sheet strength and disciplined risk taking.
Banner Investment Narrative Recap
To own Banner, you need to be comfortable with a simple idea. The bank is trying to turn a larger balance sheet, built around Pacific Financial and steady loan origination, into better efficiency without stretching its moderate risk profile. Q3 showed that story is intact, with higher net interest income, stable credit metrics and low net charge offs of US$704,000.
The main near term swing factor is whether integration and technology spending translate into cleaner cost performance as merger related expenses roll through. The biggest risk is that these costs linger longer than expected, which could keep the efficiency ratio and net margins under pressure even if loan and deposit growth stay healthy.
The dividend affirmation at US$0.52 per share for November 2026 is the announcement that matters most for this update. It signals that Banner is comfortable returning cash while absorbing acquisition expenses and integrating Pacific Financial, backed by core earnings from higher net interest income and a deposit base that management describes as resilient.
For you as a shareholder, that payout decision ties directly into the key catalysts. Execution on cost synergies, further use of the unified origination platform and measured loan growth all need to support that ongoing dividend and any future capital return. If operating leverage fails to improve, investors could start to question how sustainable this level of cash return really is.
Banner's current analyst storyline points to revenues of US$904.2 million and earnings of US$278.0 million by 2029, built on assumed revenue growth of 10.4% per year and an earnings increase of US$69.6 million from US$208.4 million today.
Uncover how Banner's fair value indicates an 8% potential upside to its current price before the market closes that gap.
Decide For Yourself
Don't just follow the ticker; dig into the data and build a conviction that's truly your own.
- A great starting point for your Banner research is our analysis highlighting 2 key rewards and 1 important warning sign that could impact your investment decision.
- See our latest analysis for Banner. The report includes a comprehensive fundamental analysis summarized in a single visual, the Snowflake, making it easy to evaluate Banner's overall financial health at a glance.
Looking For More Investment Ideas Beyond Banner?
If Banner's Q3 story has you thinking about position sizing and portfolio balance, it can help to line it up against other opportunities that share similar qualities or offer something very different. The Simply Wall St Screener gives you a structured way to do that comparison in a few focused steps.
- If you want income that does not rely on just one bank, scan for businesses with payout profiles that interest you through the 5 dividend fortresses.
- If risk control is your priority, weigh Banner against a broader universe that scores well on financial resilience by checking the 30 resilient stocks with low risk scores.
- If you are hunting for companies that may not yet sit on many radars but still show solid fundamentals, broaden your watchlist with the 21 high quality undiscovered gems.
Have feedback on this article? Concerned about the content? Get in touch with us directly. Alternatively, email editorial-team@simplywallst.com