


Okamura (TSE:7994) After Its Dividend Lift Is The Stock A Bargain Or Fairly Priced
Dividend decision puts Okamura’s cash returns in focus
Okamura (TSE:7994) has drawn fresh attention after its board approved a second quarter-end dividend of ¥52.50 per share, slightly above the prior year’s ¥52.00 payout.
The dividend decision lands as Okamura’s share price has softened recently. The stock is down 4.6% on a 1 month share price return and 4.1% lower year to date, while longer term total shareholder return of 20.2% over three years and 82.8% over five years shows the bigger income plus price picture has still rewarded patient holders.
Scan other income focused opportunities alongside Okamura by checking our hand picked 29 dividend fortresses with payout profiles that may interest dividend driven investors.
The higher interim dividend and softer recent share price pull Okamura in two directions: income story or value trap. The valuation numbers now on the table suggest which side currently looks stronger.
Price-to-earnings of 10.2x: Is it justified?
Okamura now trades on a P/E of 10.2x, which is lower than both its industry and peer averages, even after the recent share price weakness.
The P/E ratio compares the current share price to earnings per share. For a business like Okamura that already generates profit and pays a high dividend, this metric shows how much investors are paying for each unit of current earnings.
With earnings forecast to grow 2.9% per year and revenue expected to rise 3.9% per year, the modest P/E suggests the market is not pricing in aggressive expansion. The current P/E of 10.2x sits below the estimated fair P/E of 15.4x, which indicates a level the market might move towards if sentiment on those earnings improves.
The contrast is clear. The P/E of 10.2x is below the JP Commercial Services industry average of 13.2x, and well under the peer group average of 17.2x. That gap indicates Okamura is valued more conservatively than many comparable stocks on an earnings basis.
Explore the SWS fair ratio for Okamura.
Result: Price-to-earnings of 10.2x
Still, the entire revenue base comes from Japan, and any setback in the domestic office or commercial fit-out cycle could quickly challenge the current valuation story for Okamura.
Find out about the key risks to this Okamura narrative.
Another view on Okamura’s value
The earnings multiple paints one picture, but the SWS DCF model gives a much stronger one. At a share price of ¥2,228, Okamura is compared against an estimated future cash flow value of ¥6,275.59. That gap points to undervaluation. The real question is whether those cash flow assumptions feel realistic to you.
Look into how the SWS DCF model arrives at its fair value.
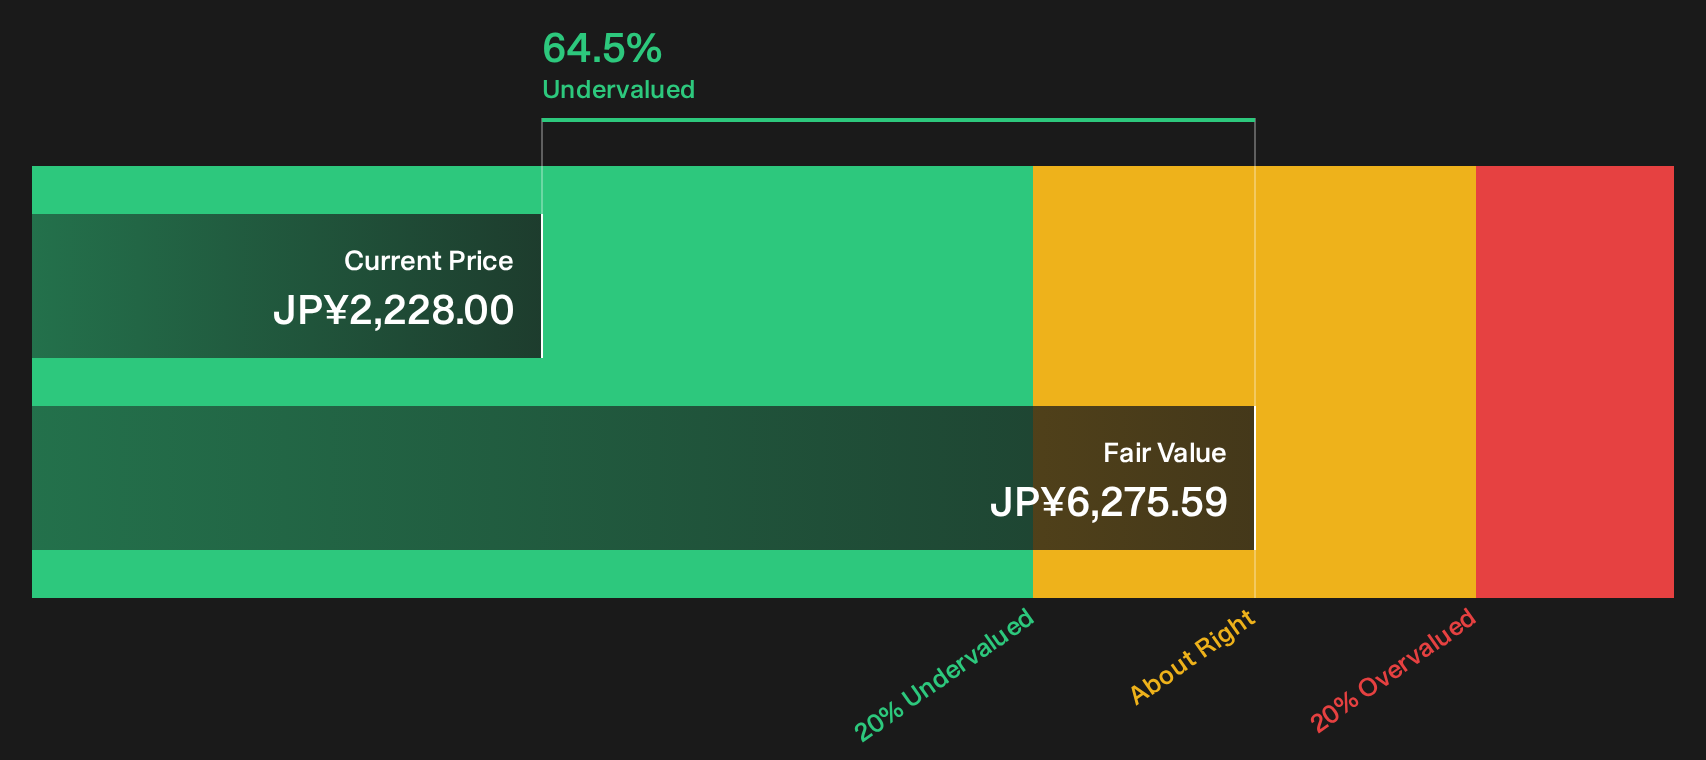
Simply Wall St performs a discounted cash flow (DCF) on every stock in the world every day (check out Okamura for example). We show the entire calculation in full. You can track the result in your watchlist or portfolio and be alerted when this changes, or use our stock screener to discover 15 high quality undervalued stocks. If you save a screener we even alert you when new companies match - so you never miss a potential opportunity.
Next Steps
If this read on Okamura leaves you torn between income appeal and valuation doubts, quickly test that instinct against the full reward profile in 5 key rewards.
Looking for more investment ideas beyond Okamura?
If Okamura has sharpened your focus on value and income, do not stop here. Casting a wider net can surface opportunities that better match your plan.
- Target resilient compounding potential by checking a 22 resilient stocks with low risk scores that may suit a more conservative approach when markets feel choppy.
- Hunt for mispriced quality by running through a 72 high quality undiscovered gems that highlights fundamentally solid businesses that many investors may be overlooking.
- Prioritise balance sheet strength through a list of solid balance sheet and fundamentals (23 results) that filters for sturdier finances to support long term dividend and reinvestment plans.
Have feedback on this article? Concerned about the content? Get in touch with us directly. Alternatively, email editorial-team@simplywallst.com