


3 Global Stocks Estimated To Be Trading At 47.5% To 49.7% Below Intrinsic Value
As global markets navigate the complexities of AI-related sell-offs and inflation pressures, investors are increasingly turning their attention to value-oriented and defensive segments. In this environment, identifying stocks trading significantly below their intrinsic value can offer opportunities for those seeking to capitalize on market inefficiencies.
Top 10 Undervalued Stocks Based On Cash Flows
| Name | Current Price | Fair Value (Est) | Discount (Est) |
| Valmet Oyj (HLSE:VALMT) | €27.00 | €53.67 | 49.7% |
| Shizuki Electric (TSE:6994) | ¥1175.00 | ¥2346.61 | 49.9% |
| PORR (WBAG:POS) | €30.80 | €61.47 | 49.9% |
| Orthex Oyj (HLSE:ORTHEX) | €4.39 | €8.72 | 49.7% |
| Kumagai GumiLtd (TSE:1861) | ¥1208.00 | ¥2415.66 | 50% |
| Kona ILtd (KOSDAQ:A052400) | ₩34900.00 | ₩69346.83 | 49.7% |
| Kingnet Network (SZSE:002517) | CN¥15.33 | CN¥30.54 | 49.8% |
| Inner Mongolia ERDOS ResourcesLtd (SHSE:600295) | CN¥14.21 | CN¥28.28 | 49.7% |
| HD Hyundai Energy SolutionsLtd (KOSE:A322000) | ₩112800.00 | ₩224159.48 | 49.7% |
| Apex Mining (PSE:APX) | ₱16.70 | ₱33.32 | 49.9% |
Let's take a closer look at a couple of our picks from the screened companies.
Koninklijke BAM Groep (ENXTAM:BAMNB)
Overview: Koninklijke BAM Groep nv, with a market cap of €3.01 billion, operates in the construction and property and civil engineering sectors across the Netherlands, the United Kingdom, Ireland, Germany, Belgium, and internationally.
Operations: The company's revenue is primarily generated from its Division Netherlands (€3.54 billion), Division United Kingdom and Ireland (€3.49 billion), and Germany, Belgium, and International operations (€123.89 million).
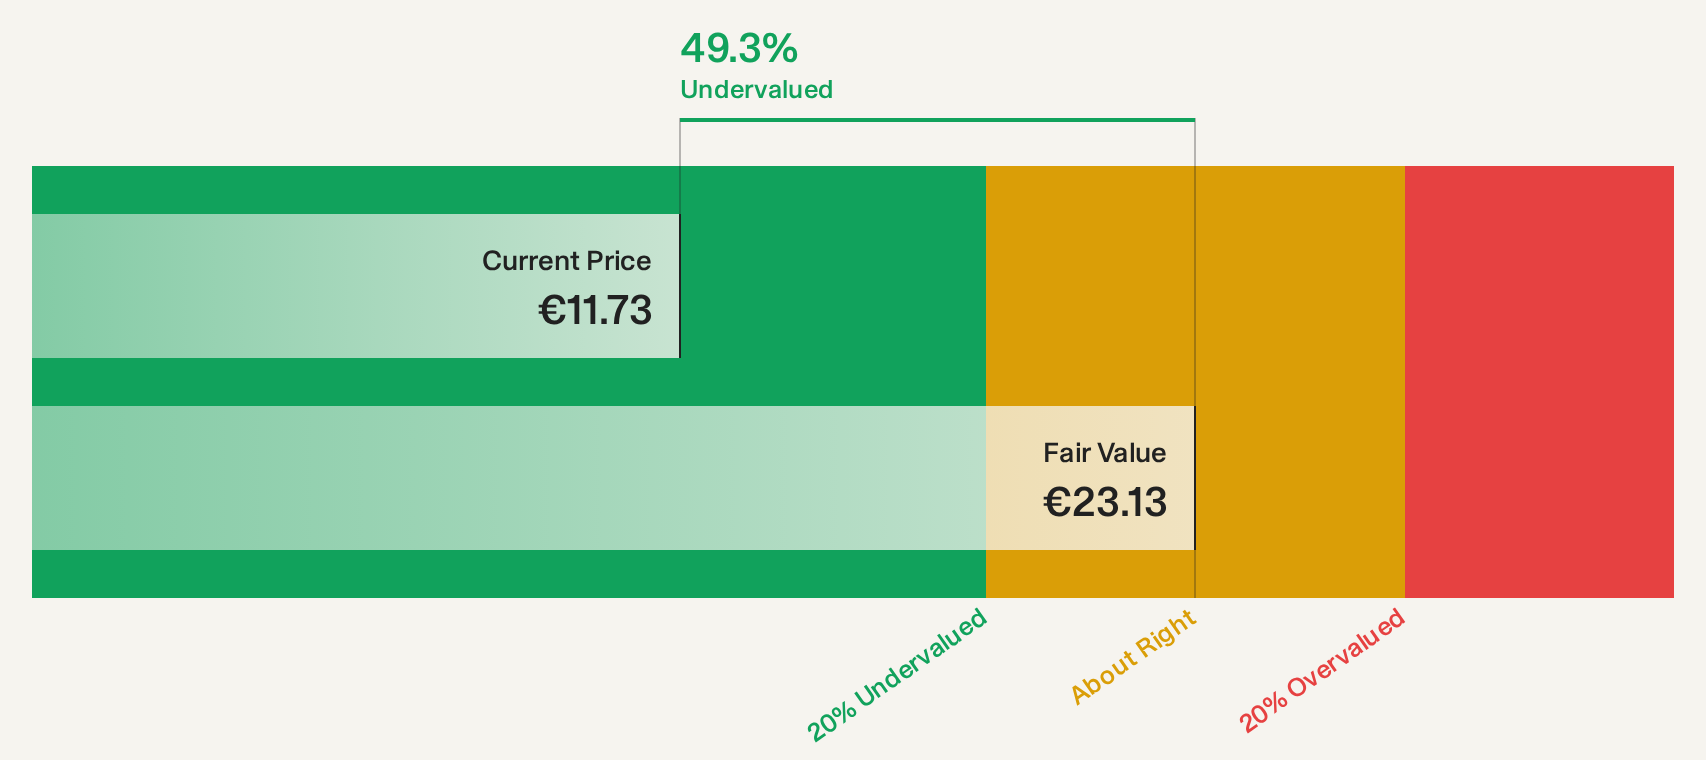
Estimated Discount To Fair Value: 49.2%
Koninklijke BAM Groep is trading at €11.72, significantly below its estimated future cash flow value of €23.07, indicating potential undervaluation based on cash flows. Despite a slower revenue growth forecast of 4.5% per year compared to the Dutch market's 11%, the company has shown strong earnings growth, with net income rising from €102 million to €127 million year-over-year for H1 2026. Analysts expect a stock price increase of 20.3%.
- Our expertly prepared growth report on Koninklijke BAM Groep implies its future financial outlook may be stronger than recent results.
- Delve into the full analysis health report here for a deeper understanding of Koninklijke BAM Groep.
Kona ILtd (KOSDAQ:A052400)
Overview: Kona I Co., Ltd. offers solutions and platforms for the financial technology market both in South Korea and internationally, with a market cap of approximately ₩487.51 billion.
Operations: The company's revenue segments include the Chip Business, generating ₩11.65 billion in Asia, ₩1.63 billion in Europe, ₩143.29 billion in the Americas, and ₩56.62 billion domestically; Other businesses contributing ₩34.78 billion domestically; the Platform business with domestic revenues of ₩89.83 billion; and the Financial Business bringing in ₩601 million domestically.
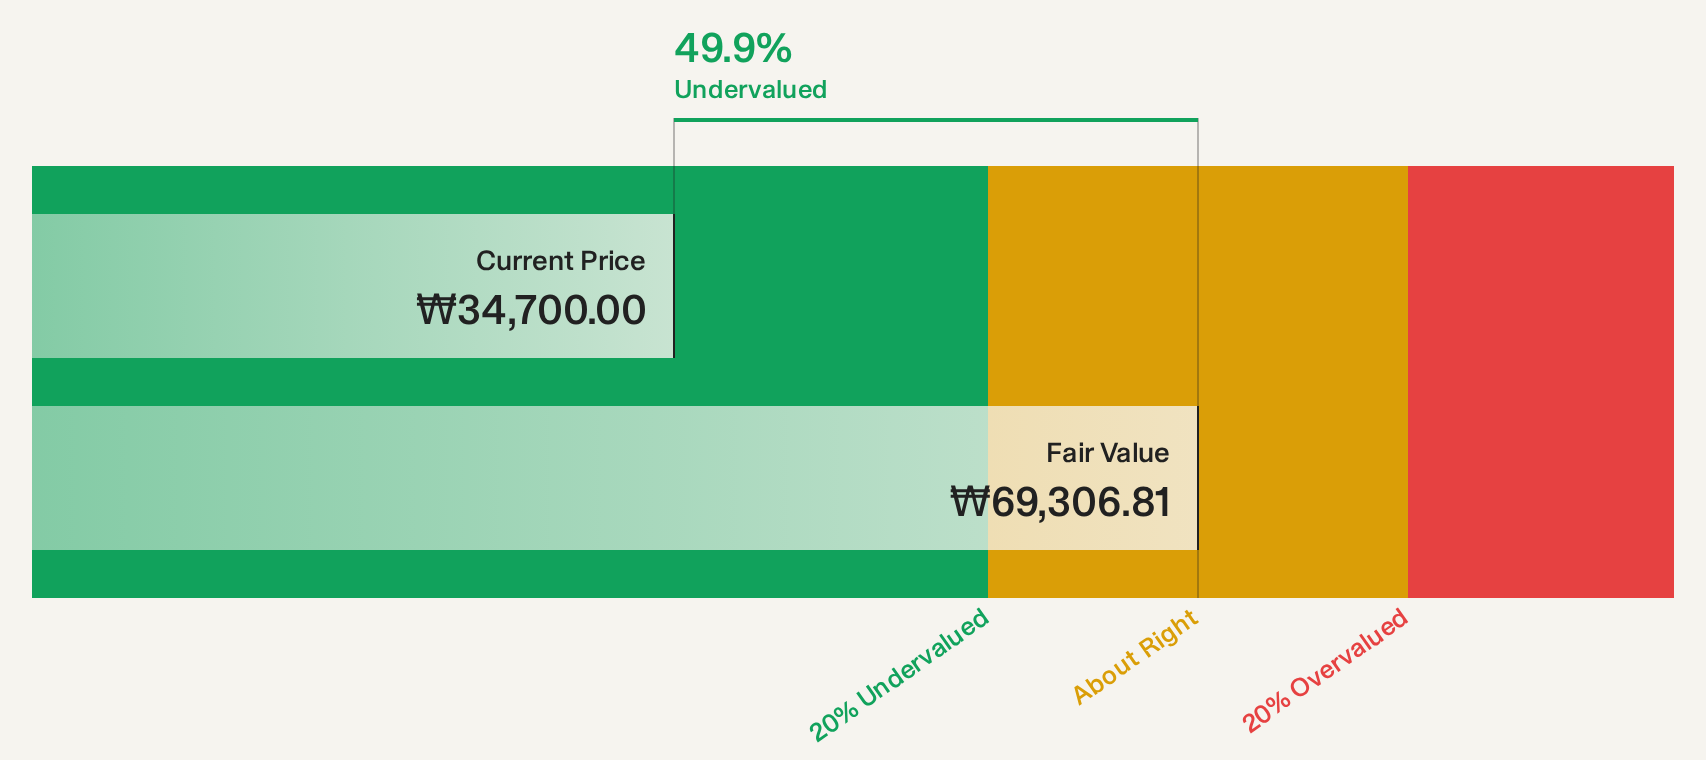
Estimated Discount To Fair Value: 49.7%
Kona I Ltd. is trading at ₩34,900, significantly below its estimated future cash flow value of ₩69,346.83, highlighting potential undervaluation based on cash flows. Despite a slower revenue growth forecast of 9.7% annually compared to the Korean market's 13.4%, recent earnings results show substantial improvement with net income rising from KRW 24.60 billion to KRW 45.95 billion year-over-year for H1 2026, reflecting strong financial performance amidst industry challenges.
- The growth report we've compiled suggests that Kona ILtd's future prospects could be on the up.
- Take a closer look at Kona ILtd's balance sheet health here in our report.
KB Financial Group (KOSE:A105560)
Overview: KB Financial Group Inc. is a multinational company offering financial products and services across various countries, including South Korea, the United States, and China, with a market cap of approximately ₩56.49 trillion.
Operations: The company's revenue is primarily derived from its banking business, with retail banking generating ₩4.09 trillion, corporate banking contributing ₩4.27 trillion, and other banking services adding ₩2.30 trillion; additionally, securities account for ₩2.80 trillion, credit card operations bring in ₩1.10 trillion, life insurance contributes ₩404.57 million, and non-life insurance adds ₩1.21 trillion to the total revenue mix.
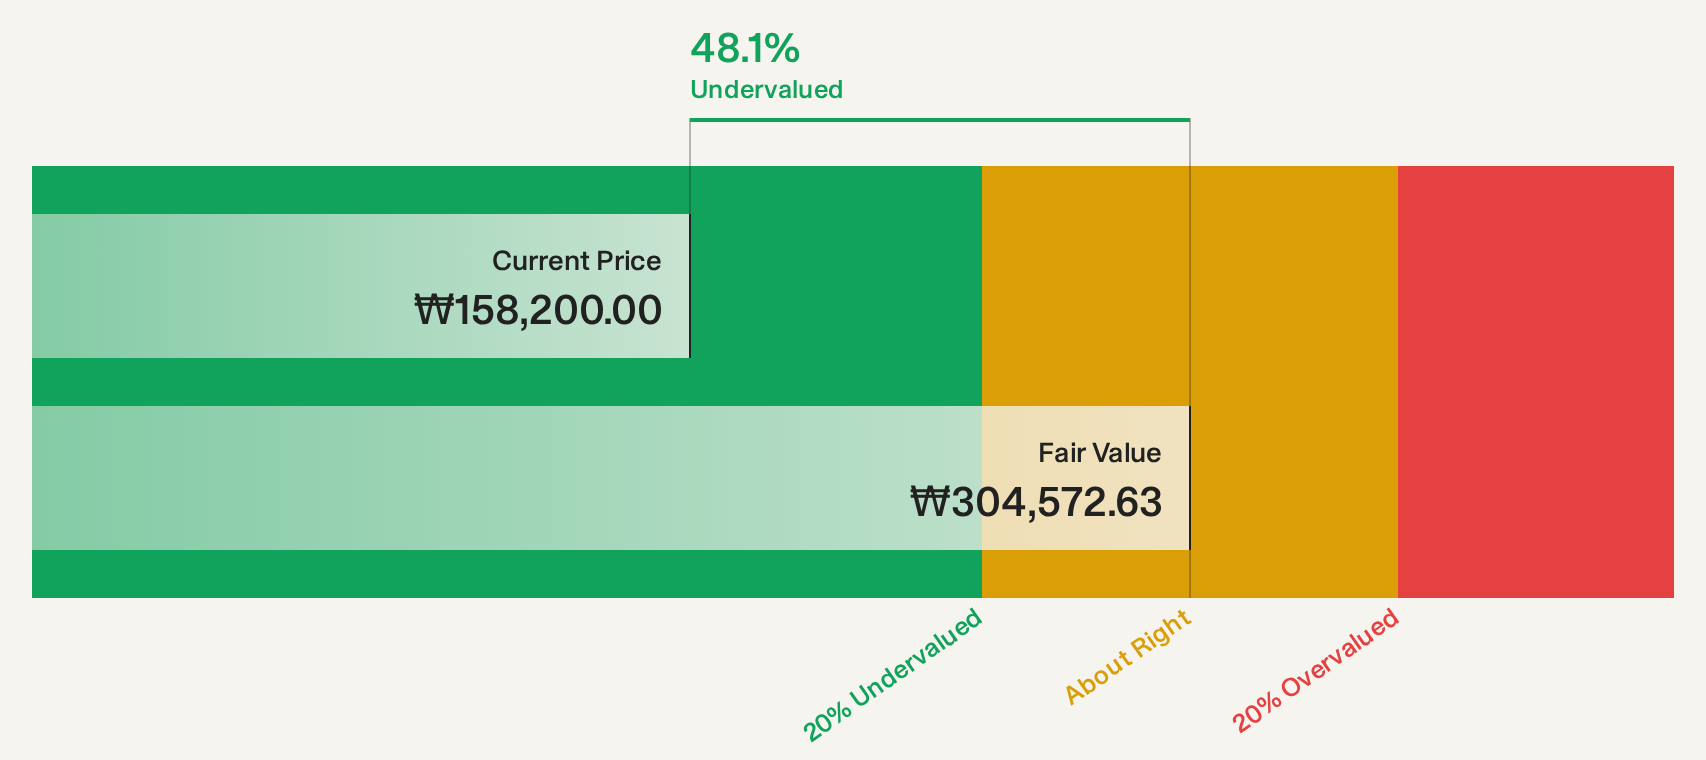
Estimated Discount To Fair Value: 47.5%
KB Financial Group is trading at ₩160,000, well below its estimated future cash flow value of ₩304,641.21, suggesting undervaluation based on cash flows. Despite this potential upside and a share buyback program aimed at enhancing shareholder returns, the company faces slower revenue growth forecasts of 5.8% annually compared to the Korean market's 13.4%. Recent earnings showed net income of KRW 3.93 trillion for H1 2026, supporting its financial stability amidst modest growth projections.
- Insights from our recent growth report point to a promising forecast for KB Financial Group's business outlook.
- Dive into the specifics of KB Financial Group here with our thorough financial health report.
Make It Happen
- Investigate our full lineup of 254 Undervalued Global Stocks Based On Cash Flows right here.
- Are any of these part of your asset mix? Tap into the analytical power of Simply Wall St's portfolio to get a 360-degree view on how they're shaping up.
- Enhance your investing ability with the Simply Wall St app and enjoy free access to essential market intelligence spanning every continent.
Ready To Venture Into Other Investment Styles?
- Explore high-performing small cap companies that haven't yet garnered significant analyst attention.
- Diversify your portfolio with solid dividend payers offering reliable income streams to weather potential market turbulence.
- Fuel your portfolio with companies showing strong growth potential, backed by optimistic outlooks both from analysts and management.
This article by Simply Wall St is general in nature. We provide commentary based on historical data and analyst forecasts only using an unbiased methodology and our articles are not intended to be financial advice. It does not constitute a recommendation to buy or sell any stock, and does not take account of your objectives, or your financial situation. We aim to bring you long-term focused analysis driven by fundamental data. Note that our analysis may not factor in the latest price-sensitive company announcements or qualitative material. Simply Wall St has no position in any stocks mentioned.
Have feedback on this article? Concerned about the content? Get in touch with us directly. Alternatively, email editorial-team@simplywallst.com