


AMTD IDEA Group (AMTD) Looks Pricey As Its 60 For 1 Stock Split Nears
AMTD IDEA Group (AMTD) is drawing fresh attention after scheduling a 60-for-1 stock split on October 19, 2026, while expanding its branded hotel network across major global cities.
Despite the upcoming 60-for-1 split and hotel rollout, AMTD IDEA Group shares have been under pressure, with the 30-day share price return down 32.26% and the 1-year total shareholder return down 53.03%, signaling fading momentum even as corporate activity accelerates.
Scan beyond AMTD IDEA Group and the upcoming 60-for-1 split by comparing it with other beaten down opportunities in the 33 high quality undervalued stocks that also pair cash generation with balance sheet strength.
AMTD IDEA Group has a sharply weaker share price alongside an upcoming 60-for-1 split, which puts a spotlight on one thing: Where does fair value really sit relative to the range of estimates now in play?
Price-to-Earnings of 68.4x: Is it justified?
Valuation for AMTD IDEA Group skews to one clear signal, with the shares trading on a P/E of 68.4x against a last close of $29.87 and no obvious support from recent earnings trends.
The P/E ratio links the current share price to the latest earnings per share and shows how many dollars investors are paying for each dollar of profit. For a capital markets focused business, this measure is often used as a shorthand for how optimistic the market is about future profitability or stability of earnings.
AMTD IDEA Group has earnings that have declined by 21.6% per year over the past 5 years and profit margins that moved from 69.7% to 46.8%. This means the P/E of 68.4x implies the equity market is assigning a rich valuation to shrinking profitability. Our DCF work points in the same direction, with the SWS DCF model indicating an estimated future cash flow value of $5.87 per share compared with the current price of $29.87. This suggests investors are paying a high premium over that cash flow based estimate.
The comparison with peers is stark. AMTD IDEA Group trades at a P/E of 68.4x, while the peer group average sits at 17x and the wider US Capital Markets industry sits at 38.1x. This signals that the current multiple is materially higher than both direct peers and the broader sector.
See what the numbers say about this price — find out in our valuation breakdown.
Result: Preferred multiple of 68.4x P/E (OVERVALUED)
Still, AMTD IDEA Group faces real downside risk if earnings continue to contract or if the hotel and media segments fail to support overall profitability.
Find out about the key risks to this AMTD IDEA Group narrative.
Another View: What The SWS DCF Model Says
A second lens on AMTD IDEA Group comes from the SWS DCF model, which estimates future cash flows at $5.87 per share compared with the current price of $29.87. That points to a very rich price tag. If earnings keep sliding, where does support for this gap really come from?
Look into how the SWS DCF model arrives at its fair value.
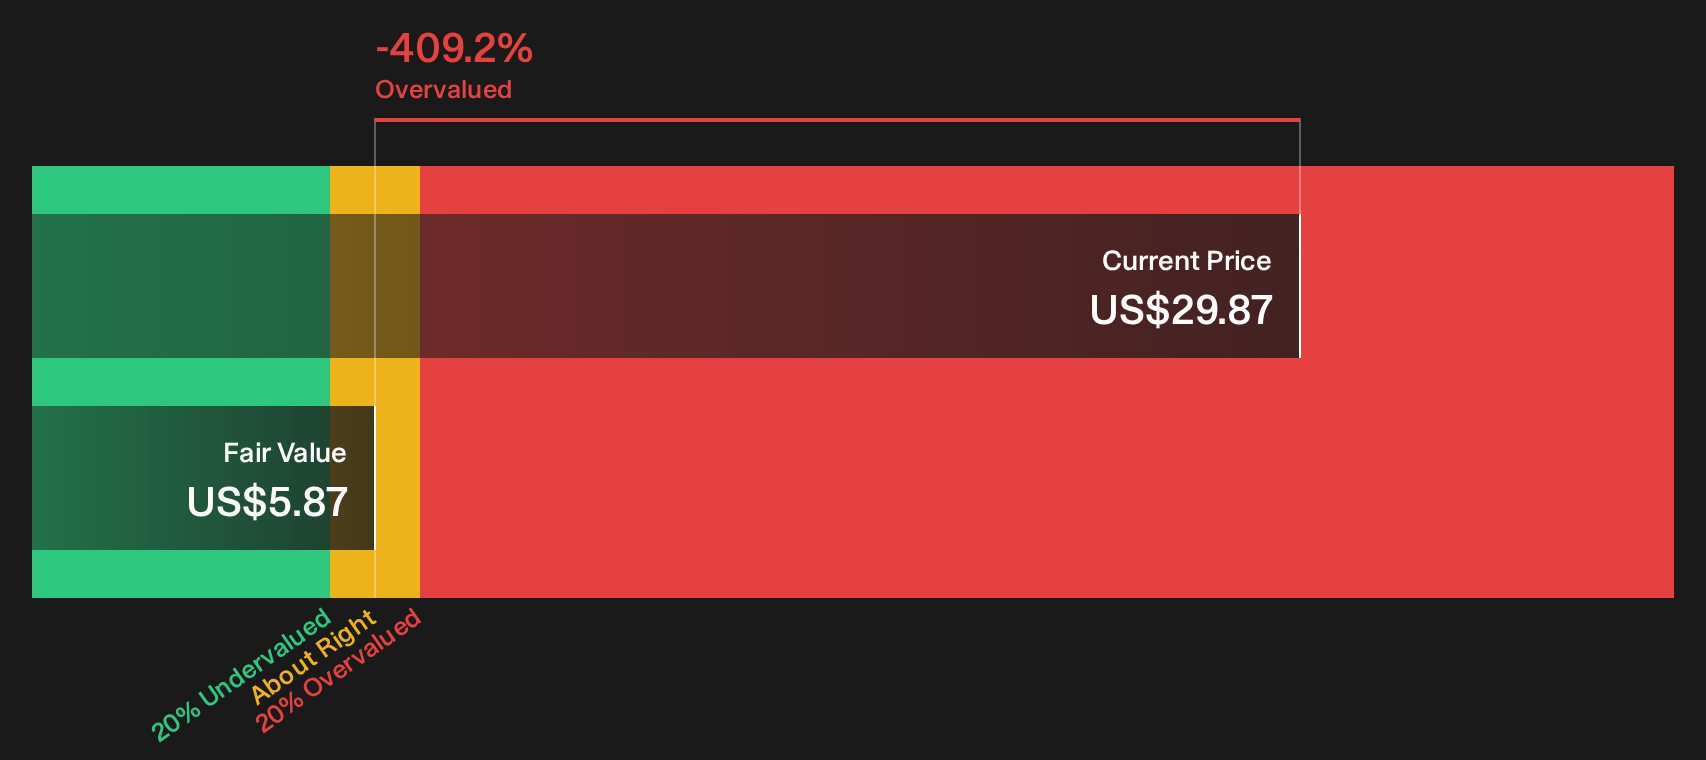
Simply Wall St performs a discounted cash flow (DCF) on every stock in the world every day (check out AMTD IDEA Group for example). We show the entire calculation in full. You can track the result in your watchlist or portfolio and be alerted when this changes, or use our stock screener to discover 33 high quality undervalued stocks. If you save a screener we even alert you when new companies match - so you never miss a potential opportunity.
Next Steps
That valuation gap around AMTD IDEA Group either looks excessive or simply ahead of where sentiment is willing to go right now. Consider reviewing the underlying figures yourself and deciding whether the caution is justified, then weigh those findings against the 4 important warning signs.
Looking for more AMTD IDEA Group sized opportunities?
If AMTD IDEA Group has you questioning where valuation and quality truly meet, do not stop here. Use the screeners below to pressure test fresh ideas.
- Target resilience by focusing on companies that pair durable fundamentals with modest volatility through the 32 resilient stocks with low risk scores.
- Hunt for quality at a discount by comparing current valuations with fundamentals using the 20 high quality undiscovered gems.
- Zero in on balance sheet strength by filtering for businesses with robust financial footing in the list of solid balance sheet and fundamentals (25 results).
This article by Simply Wall St is general in nature. We provide commentary based on historical data and analyst forecasts only using an unbiased methodology and our articles are not intended to be financial advice. It does not constitute a recommendation to buy or sell any stock, and does not take account of your objectives, or your financial situation. We aim to bring you long-term focused analysis driven by fundamental data. Note that our analysis may not factor in the latest price-sensitive company announcements or qualitative material. Simply Wall St has no position in any stocks mentioned.
Have feedback on this article? Concerned about the content? Get in touch with us directly. Alternatively, email editorial-team@simplywallst.com