


BT Group (LSE:BT.A) Could Be 7% Undervalued After Verizon Linked Reshuffle
BT Group (LSE:BT.A) is back in focus after management reshuffled senior roles linked to a planned acquisition and an international joint venture with Verizon, moves that arrived alongside a sharp 1-day share price gain.
That 1-day share price return of 1.35% sits on top of a 7-day share price gain of 8.79% and a year-to-date share price return of 14.12%. Total shareholder returns of 18.65% over 1 year and very large gains over 3 and 5 years suggest momentum around BT Group is still building rather than fading.
Compare BT Group's momentum and perceived value reset with other hand-picked telecoms and infrastructure plays using the 7 high quality undervalued stocks screening list.
For BT Group, the jump in the share price after the Verizon-linked reshuffle either flags a genuine reset in how the business is viewed or a short burst of optimism. How does the valuation stack up against that choice?
Most Popular Narrative: 6.5% Undervalued
On the most followed view, BT Group’s fair value of £2.24 sits modestly above the last close at £2.10, which puts the recent rally in context as a catch-up rather than a stretch move.
The move past peak investment, with group CapEx of £5.1b in FY26 expected to fall to around £4.3b in FY27 and by well over £1b by FY30 as FTTP build and IT modernization ease back, gives BT Group room for normalized free cash flow to move ahead of reported EBITDA trends and to support higher equity value through stronger cash generation.
See why 93 investors see BT Group as 7% undervalued.
Result: Fair Value of £2.24 (UNDERVALUED)
Still, BT Group’s fibre and cash flow narrative can unravel if weakness in the Business segment outside the U.K. deepens or if legacy voice revenue erosion outweighs fibre gains.
Find out about the key risks to this BT Group narrative.
Another View on BT Group’s Valuation
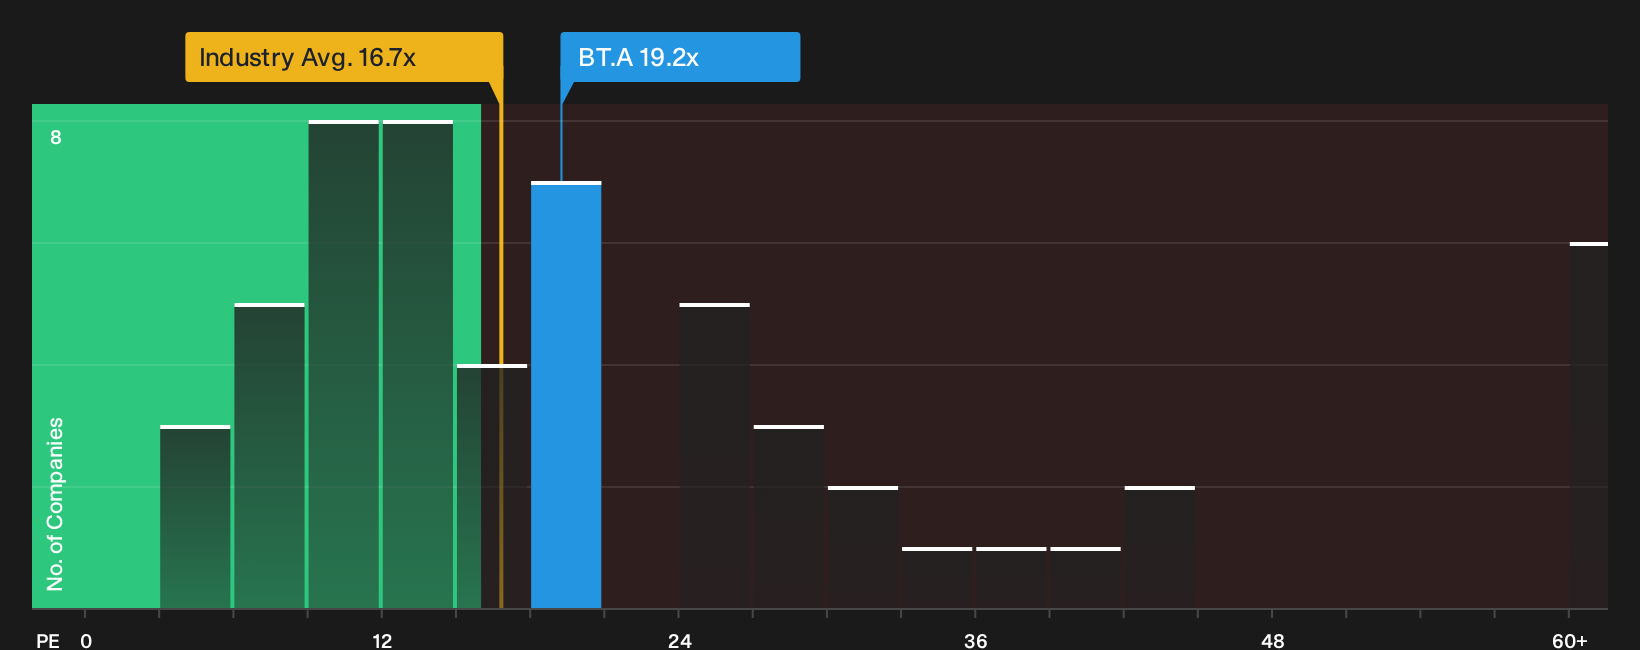
The first lens on BT Group leans on analyst fair value of £2.24, which implies a modest 6.5% upside to the £2.10 share price. A different picture emerges when looking at the P/E. The stock trades on 19.2x compared with a fair ratio of 15.7x and a European telecom average of 16.7x, so the current tag looks richer than both its own fair ratio and the wider sector. If the market drifts closer to that fair ratio, how comfortable are you with the valuation risk baked into today’s price?
To pressure test that view against hard numbers, take a closer look at what the valuation multiples are implying for BT Group, and how they compare with peers, using the See what the numbers say about this price — find out in our valuation breakdown..
Next Steps
Sentiment around BT Group is clearly mixed, with both concern and optimism in play. Take a moment to weigh the evidence yourself and move quickly to shape your own view using 2 key rewards and 3 important warning signs.
Looking for more investment ideas beyond BT Group?
If BT Group has sharpened your focus, do not stop here. The next edge often comes from the ideas you check today, not the ones you postpone.
- Target potential mispricings across the market by scanning a curated pool of opportunities using the 7 high quality undervalued stocks.
- Build a steadier income stream by filtering for robust payouts and balance sheets through the 2 dividend fortresses.
- Look for potential future leaders before the crowd by running the 5 high quality undiscovered gems.
This article by Simply Wall St is general in nature. We provide commentary based on historical data and analyst forecasts only using an unbiased methodology and our articles are not intended to be financial advice. It does not constitute a recommendation to buy or sell any stock, and does not take account of your objectives, or your financial situation. We aim to bring you long-term focused analysis driven by fundamental data. Note that our analysis may not factor in the latest price-sensitive company announcements or qualitative material. Simply Wall St has no position in any stocks mentioned.
Have feedback on this article? Concerned about the content? Get in touch with us directly. Alternatively, email editorial-team@simplywallst.com