


Is Loews (L) Fully Priced After Its 92% Five Year Run?
Loews (L) has caught investor attention after a 92.4% share price gain over five years, prompting fresh scrutiny of whether its current valuation lines up with the capital returns it generates.
Recent trading has been steady rather than explosive, with a 7 day share price return of 3.6% and a year to date share price gain of 5.6%. The 1 year total shareholder return of 12.1% and 5 year total shareholder return of 95.3% suggest long term momentum has been stronger than the more mixed 90 day share price move, which is down 3.6% from recent highs around the current US$110.52 level.
Compare Loews with a curated short list of insurers and financials that also show strong multi year shareholder returns in our 33 high quality undervalued stocks.
Loews now trades close to its estimated intrinsic value after that strong multi year run. Is the market simply cautious about what comes next, or is it fairly weighing the capital the group already controls?
Price-to-Earnings of 13.4x: Is it justified?
Loews now trades on a P/E of 13.4x against a last close of $110.52, which leaves the stock priced above both its peer group and the wider US insurance sector while still sitting below the broader US market level.
The P/E ratio compares the current share price to the earnings per share. For a diversified insurer like Loews, this metric gives you a quick read on how much investors are willing to pay for each dollar of current profit from its insurance, pipelines, hotels, and manufacturing operations.
The multiple is higher than the peer average of 11.6x and above the US insurance industry average of 11x. That gap signals investors are paying a premium relative to sector alternatives, even though Loews carries a low 8.9% return on equity and earnings that have grown 4.2% per year over five years, with a stronger 25.1% gain over the past year.
Compared with the broader US market P/E of 18.1x, the stock trades at a discount, which points to a lower valuation than the wider equity market while still looking expensive relative to insurance peers that share similar business risks and capital intensity.
See what the numbers say about this price — find out in our valuation breakdown.
Result: Price-to-Earnings of 13.4x (OVERVALUED)
Still, Loews faces real pressure if insurance underwriting weakens or if its hotel and pipeline subsidiaries struggle to support group level profitability at this richer P/E.
Find out about the key risks to this Loews narrative.
Another View: Loews Through a Cash Flow Lens
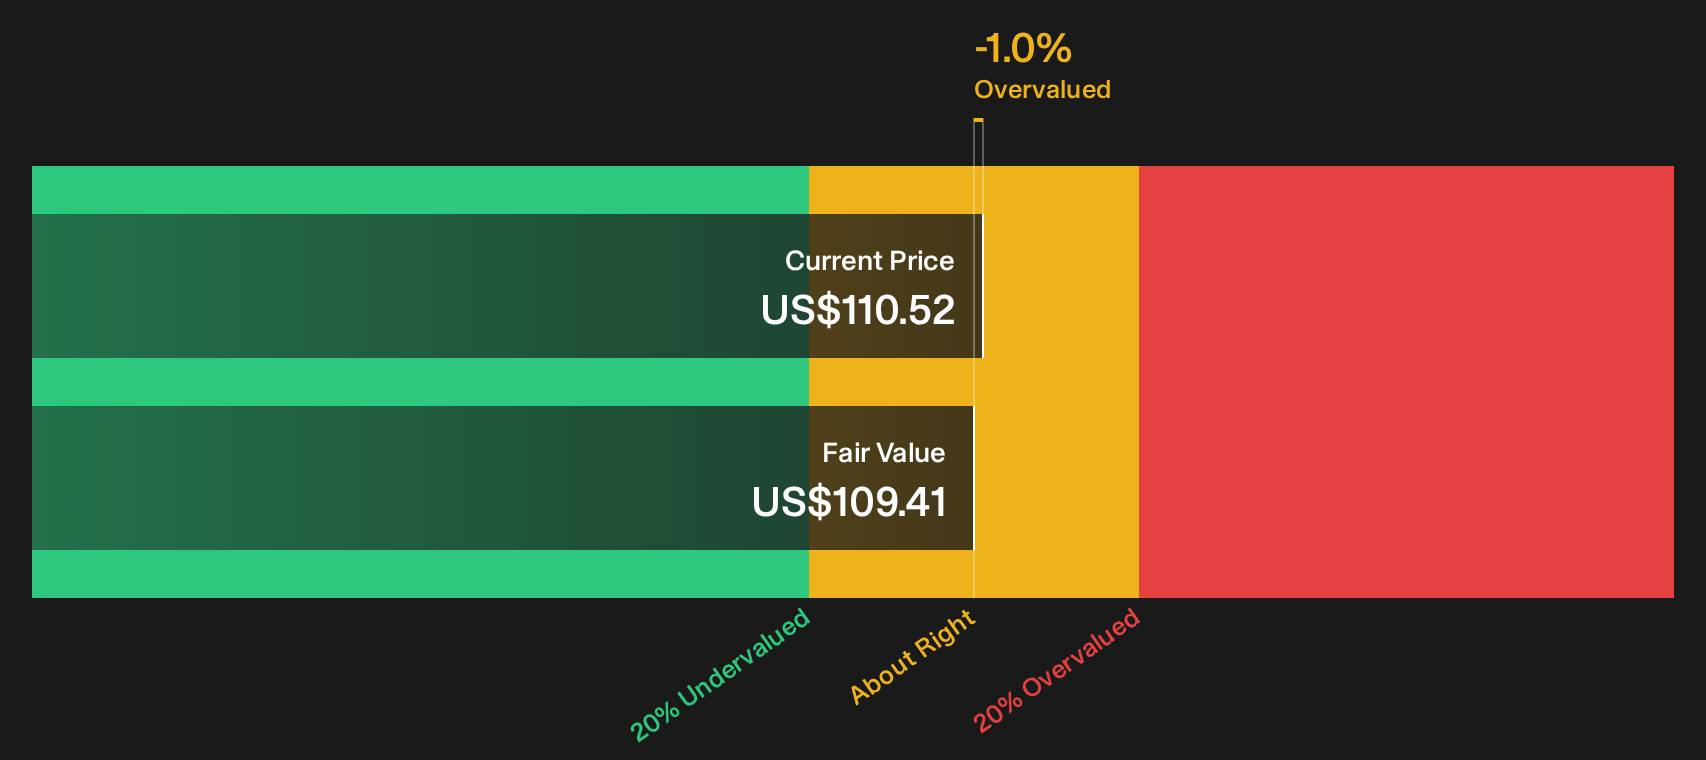
The earnings multiple paints Loews as expensive against insurers, yet the SWS DCF model lands almost on the same spot. With an estimated future cash flow value of $109.41 versus a market price of $110.52, the stock screens as slightly overvalued rather than obviously cheap.
That $1 gap is small in dollar terms, but it hints that recent enthusiasm may already be captured in the quote. If both profit based and cash flow based approaches cluster around the current level, where exactly is the edge for new capital going in today?
Look into how the SWS DCF model arrives at its fair value.
Simply Wall St performs a discounted cash flow (DCF) on every stock in the world every day (check out Loews for example). We show the entire calculation in full. You can track the result in your watchlist or portfolio and be alerted when this changes, or use our stock screener to discover 33 high quality undervalued stocks. If you save a screener we even alert you when new companies match - so you never miss a potential opportunity.
Next Steps
Sentiment on Loews is mixed in the numbers, so move quickly, test the assumptions against your own expectations, and pressure test the upside drivers highlighted in the 2 key rewards
Looking for more investment ideas beyond Loews?
If Loews already sits on your radar, broaden your watchlist with a handful of focused stock ideas that align more closely with how you like to put capital to work.
- Target dependable income streams by reviewing our list of potential high yield payers in the 8 dividend fortresses.
- Hunt for resilient balance sheets by scanning companies in the list of solid balance sheet and fundamentals (25 results).
- Spot underfollowed opportunities early by checking the 20 high quality undiscovered gems.
This article by Simply Wall St is general in nature. We provide commentary based on historical data and analyst forecasts only using an unbiased methodology and our articles are not intended to be financial advice. It does not constitute a recommendation to buy or sell any stock, and does not take account of your objectives, or your financial situation. We aim to bring you long-term focused analysis driven by fundamental data. Note that our analysis may not factor in the latest price-sensitive company announcements or qualitative material. Simply Wall St has no position in any stocks mentioned.
Have feedback on this article? Concerned about the content? Get in touch with us directly. Alternatively, email editorial-team@simplywallst.com