


Stock Yards Bancorp (SYBT), What Is Drawing Fresh Attention Now?
Stock Yards Bancorp (SYBT) drew fresh attention after Stock Yards Bank & Trust named Benjamin Caudill president for its Central and Eastern Kentucky market, a leadership change that sharpened focus on the bank's recent net interest income performance.
Recent trading tells a mixed story. Stock Yards Bancorp’s share price is up 17.61% year to date and the latest close sits at US$76.69, yet the 30 day return is down 3.38% and the 90 day share price return is down 5.09%. This suggests momentum has cooled even as the 3 year total shareholder return of 108.21% and 1 year total shareholder return of 17.48% keep the longer term trend firmly positive.
See how Stock Yards Bancorp compares with other banks showing resilient earnings trends by reviewing our handpicked list of 32 resilient stocks with low risk scores in the current market cycle.
Stock Yards Bancorp has already delivered strong multiyear gains, yet recent cooling in the share price hints at a breather. Is most of the upside already priced in, or does valuation still leave room ahead?
Preferred P/E of 15.9x: Is it justified for Stock Yards Bancorp?
Valuation on earnings is pulling in two directions for Stock Yards Bancorp. The stock trades on a P/E of 15.9x while also screening as cheap against an internal fair value estimate, which flags a 35.4% discount to that modelled figure.
The P/E ratio compares the current share price with annual earnings per share. For a bank such as Stock Yards Bancorp, this yardstick helps you see how much investors are willing to pay for each dollar of profit in a sector where profitability, credit quality, and capital levels are constant points of comparison.
SYBT’s headline checks show earnings growth of 15.3% per year over the past 5 years and forecast profit growth of 9.53% per year, which aligns with a business that has been growing but not at especially high rates. Against that backdrop, a P/E of 15.9x implies investors are paying a premium to the peer group average of 11.3x and to the broader US Banks industry average of 11.5x. In the same framework, the multiple also appears rich compared to an estimated fair P/E of 12x, indicating the market is assigning a higher price than that fair ratio level could support.
SYBT is therefore portrayed as expensive based on its current P/E when stacked against sector averages and the fair P/E marker, even though the stock also screens as undervalued on a separate future cash flow assessment.
Explore the SWS fair ratio for Stock Yards Bancorp.
Result: Price-to-earnings of 15.9x (OVERVALUED).
Still, Stock Yards Bancorp faces real pressure if loan demand weakens or credit quality softens, especially given that a premium P/E is already in place.
Find out about the key risks to this Stock Yards Bancorp narrative.
Another view on Stock Yards Bancorp’s valuation
The earnings multiple presents Stock Yards Bancorp as expensive, yet the SWS DCF model indicates a different picture. On that cash flow view, the shares trade at a 35.4% discount to an estimated value of $118.78, which frames recent pricing as more of a potential gap than a premium. Which signal would you trust if they remain out of sync?
Look into how the SWS DCF model arrives at its fair value.
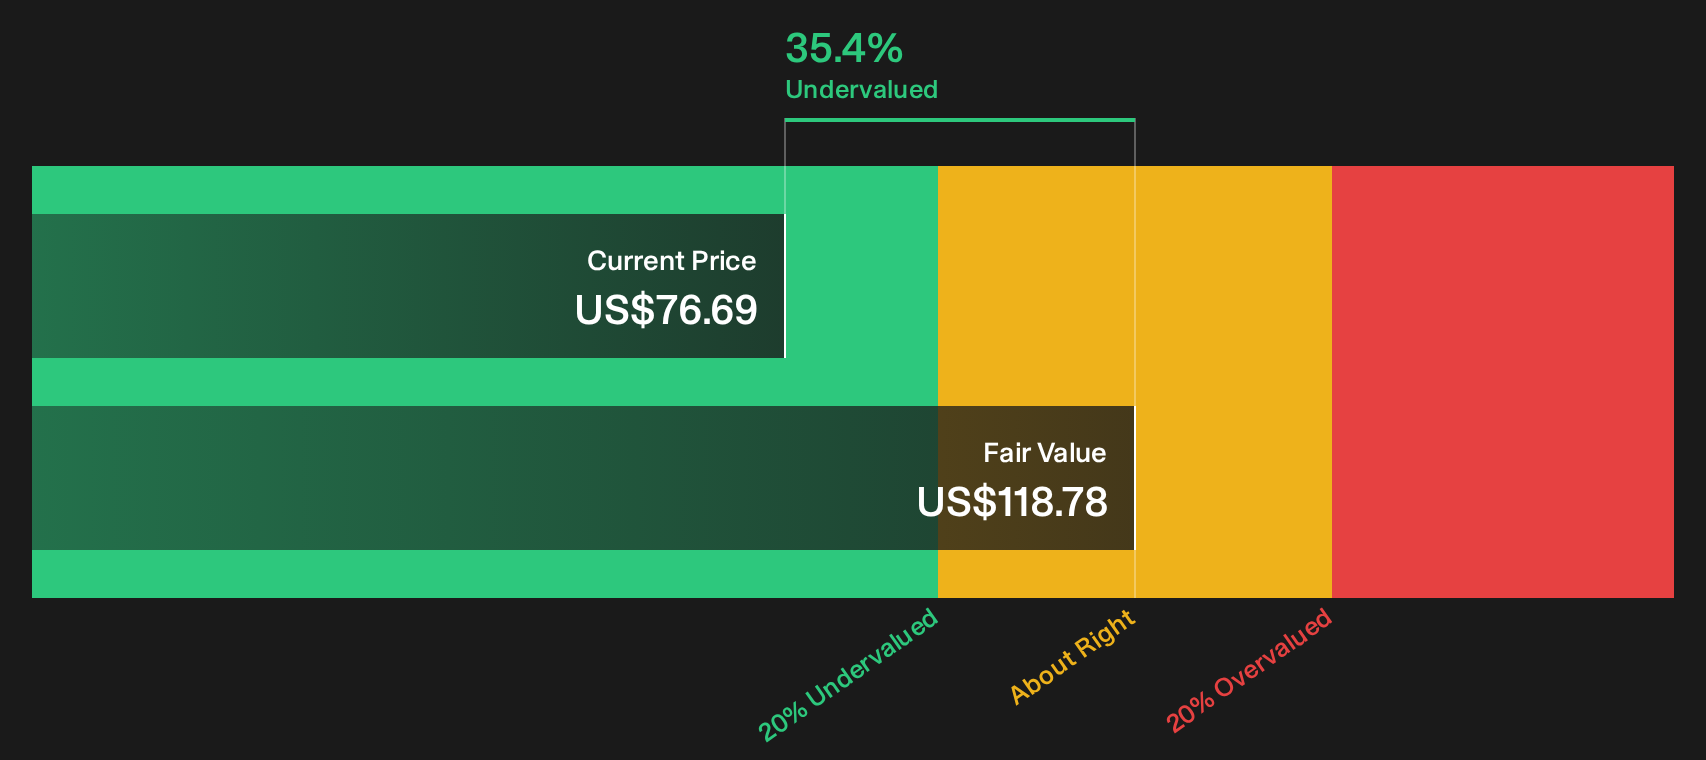
Simply Wall St performs a discounted cash flow (DCF) on every stock in the world every day (check out Stock Yards Bancorp for example). We show the entire calculation in full. You can track the result in your watchlist or portfolio and be alerted when this changes, or use our stock screener to discover 33 high quality undervalued stocks. If you save a screener we even alert you when new companies match - so you never miss a potential opportunity.
Next Steps
Plenty of signals around Stock Yards Bancorp point in different directions, so do not wait on someone else to decide what they mean. Weigh both the concerns and the potential upsides in one place by reviewing the 4 key rewards and 1 important warning sign
Looking for more Stock Yards Bancorp sized investment ideas?
If you stop with Stock Yards Bancorp, you risk missing other opportunities that fit your style. Use the Simply Wall St Screener to quickly surface fresh, evidence based ideas that match your risk, income, and value preferences.
- Target portfolio stability by reviewing companies with strong fundamentals using our focused list of solid balance sheet and fundamentals (25 results).
- Hunt for tomorrow's potential bargains by scanning a curated 20 high quality undiscovered gems before others catch on.
- Build a cash flow focused portfolio with a carefully filtered 8 dividend fortresses that aims to pair higher yields with resilient business profiles.
This article by Simply Wall St is general in nature. We provide commentary based on historical data and analyst forecasts only using an unbiased methodology and our articles are not intended to be financial advice. It does not constitute a recommendation to buy or sell any stock, and does not take account of your objectives, or your financial situation. We aim to bring you long-term focused analysis driven by fundamental data. Note that our analysis may not factor in the latest price-sensitive company announcements or qualitative material. Simply Wall St has no position in any stocks mentioned.
Have feedback on this article? Concerned about the content? Get in touch with us directly. Alternatively, email editorial-team@simplywallst.com