


Why GrafTech International Bears Were Right Before A 60% Drop
GrafTech International offered a clear test of conviction. Holding GrafTech International over the past year would have meant a 59.9% loss, including dividends. If you had backed the bullish view in October 2025, you were effectively betting on rapid revenue expansion, a swing from heavy losses to roughly 10% margins, and a rerating to a mid single digit P/E. What, exactly, did that optimistic case leave out about electrode pricing, customer concentration, and execution risk?
The useful thing about a Narrative is that the reasoning is checkable: the assumptions sit beside the argument, and together they imply an estimated Fair Value you can disagree with.
The easy part of this move is behind GrafTech International. Zero in on 33 high quality undervalued stocks for companies trading below our estimates.
The Argument Investors Had To Settle On GrafTech International
The shares cost US$16.66 at the start of the period, and anyone looking at GrafTech International had to choose between two very different stories about what came next.
The optimistic narrative put Fair Value at US$20, built on revenue growing 28.7% a year and profit margins shifting from a heavy loss to 9.9%, with a future P/E of 6.9x.
The more cautious view set Fair Value at US$13.25, assumed 24.5% annual revenue growth and a margin moving to 10.2%, but warned that persistent electrode oversupply could keep pricing weak.
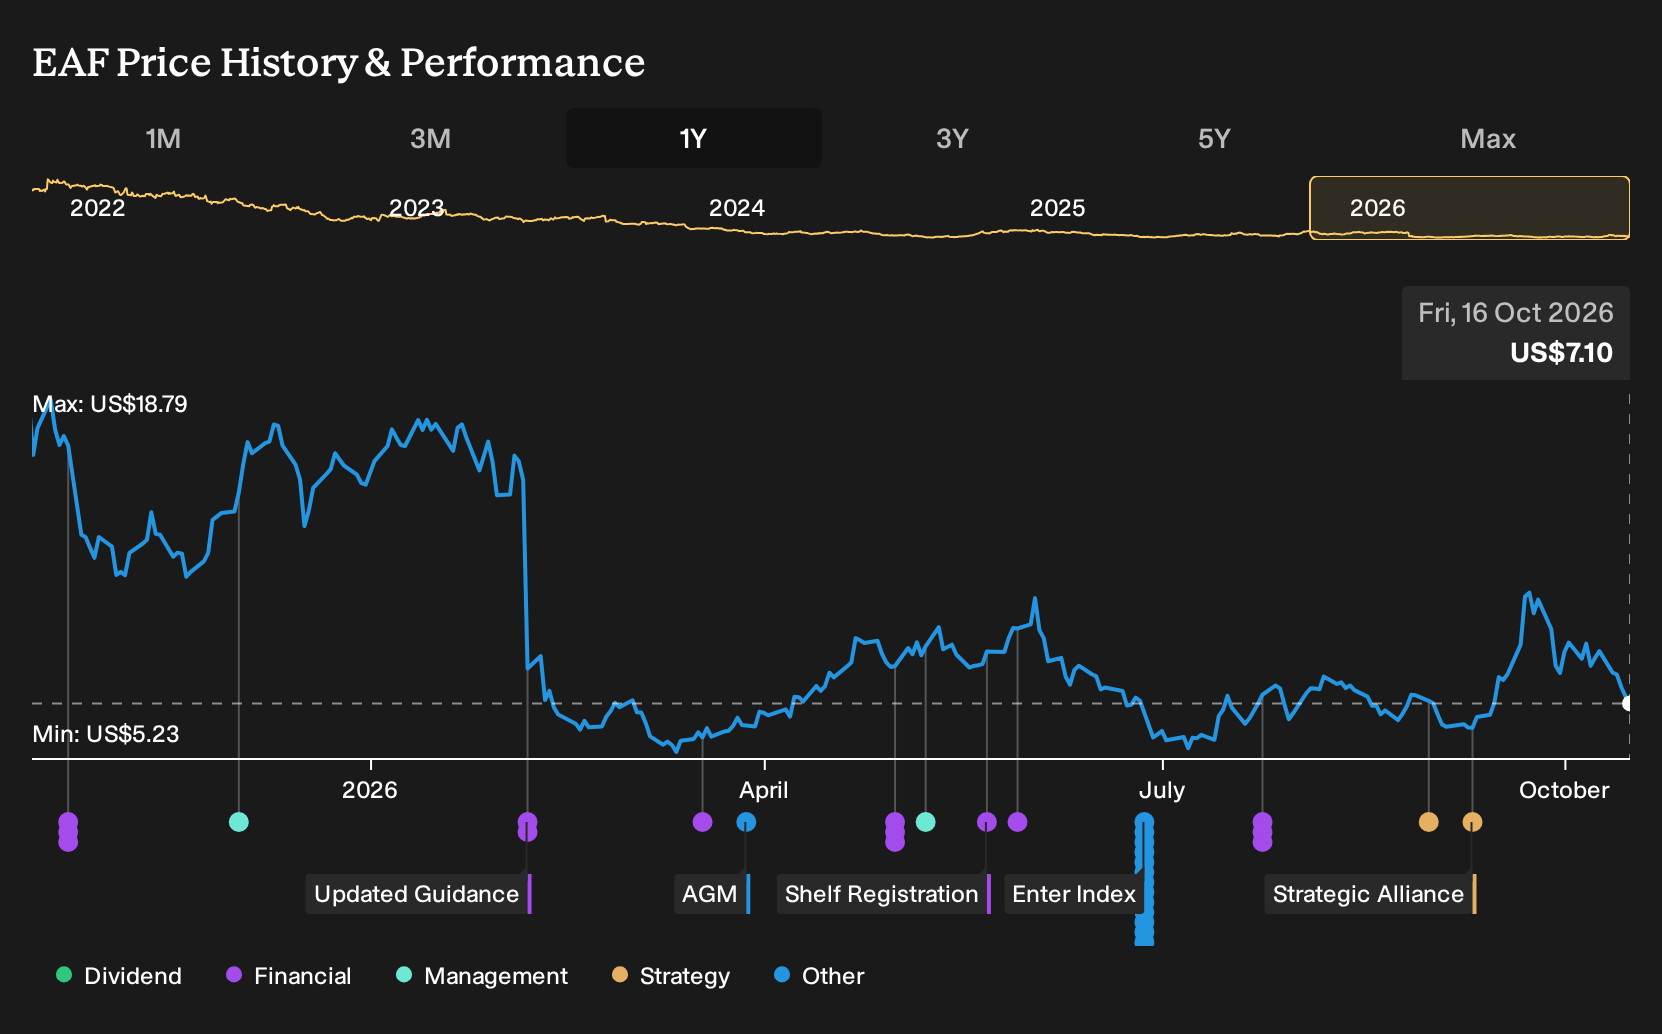
What The Results Changed For GrafTech International
The most concrete update for GrafTech International came from its Q2 2026 filing. Revenue slipped from US$131.84m in Q2 2025 to US$127.36m, which challenged the aggressive growth slope in the optimistic case. Profit loss narrowed from US$86.89m to US$40.47m and net margin improved from a loss of 65.9% to a loss of 31.8%, so profitability progress supported the more cautious scenario, not a clean swing to strong earnings.
The lesson is simple. When a story leans on rapid margin repair, you track both the loss level and the signed net margin each quarter, and you test whether the direction and speed of that shift match the original promise.
What You Are Paying For In GrafTech International Today
GrafTech International now trades at US$7.1, after a 59.9% loss over the past year. The selected Narrative sees Fair Value above that level, based on the idea that electrode pricing, cost control, and new carbon material uses gradually repair the economics.
For that Fair Value to be reached, a buyer today would need to assume sustained demand growth for GrafTech International from electric arc furnaces and related EV supply chains.
"Ongoing shift of steel production from blast furnaces to electric arc furnaces (EAF), particularly in the U.S. and Europe, due to increased infrastructure spending and decarbonization initiatives, is set to drive sustained long-term demand for graphite electrodes, supporting future revenue growth."
One Narrative has put a figure on that disagreement. → See the Narrative with its higher Fair Value, assumptions and all
How Could You Get There Earlier?
This company's disappointment is already part of the story. Your next idea could come from looking where the price and the possibilities still seem far apart. Here are three companies priced below our estimates.
- Company 1 - 42% below our estimate - advises on complex product failures, regulatory challenges and technical disputes across industries.
- Company 2 - 46% below our estimate - converts a record backlog of data-center and modular builds into higher-margin service work.
- Company 3 - 32% below our estimate - runs higher cost gold mines that trade resource depth for geopolitical and cash flow risk.
Those are three of them. See all 25 companies with the balance sheet to back it up →
This article by Simply Wall St is general in nature. We provide commentary based on historical data and analyst forecasts only using an unbiased methodology and our articles are not intended to be financial advice. It does not constitute a recommendation to buy or sell any stock, and does not take account of your objectives, or your financial situation. We aim to bring you long-term focused analysis driven by fundamental data. Note that our analysis may not factor in the latest price-sensitive company announcements or qualitative material. Simply Wall St has no position in any stocks mentioned.
Have feedback on this article? Concerned about the content? Get in touch with us directly. Alternatively, email editorial-team@simplywallst.com