


Technogym (BIT:TGYM) Is Drawing Fresh Attention, So What Is The Market Weighing?
Technogym (BIT:TGYM) drew fresh attention after its Technogym Checkup system received a special mention in Time’s Best Inventions 2026, highlighting its AI-driven approach to preventive health and personalized training plans.
Set against that recognition, Technogym’s €12.95 share price comes after a 1-day share price return of 1.25% and a 30-day share price gain of 2.45%, even though the share price declined 10.44% over 90 days and is down 20.26% year to date, while total shareholder return over three and five years is 95.13% and 51.88% respectively. This suggests long term holders have still seen substantial value creation despite more recent momentum fading.
Scan for other fitness and AI-driven wellness stocks that could echo Technogym’s Checkup story by reviewing our curated list of 127 healthcare AI stocks.
Technogym now trades at €12.95, while analyst and model estimates point meaningfully higher, leaving a wide gap. Is the fair value closer to those targets, or is it already reflected in today’s price?
Price-to-Earnings of 22.1x: Is it justified?
On current figures, Technogym changes hands at a P/E of 22.1x, while internal modelling and analyst views still flag upside to fair value levels. The share price of €12.95 trades at a 15.7% discount to one fair value estimate of €15.36 and sits about 38.9% below the average analyst target of €17.99.
The P/E multiple reflects how much investors are paying today for each euro of Technogym earnings. For a business earning €116.5m on €1.05b of revenue, with earnings forecast to grow around 9.15% a year and revenue projected to rise 7.5% a year, a mid‑20s earnings multiple suggests the market is already assigning a premium for profitability, return on equity and growth consistency.
Context versus peers matters. Technogym looks expensive relative to the SWS fair P/E ratio of 19.6x, a level the market could move towards if sentiment cools, and it also trades richer than the broader European Leisure industry average P/E of 17.4x. At the same time, it screens cheaper than its closer peer set on a P/E of 28.2x, so investors are paying less for each euro of profit than for comparable leisure and wellness stocks while still accepting a premium to the wider industry.
Explore the SWS fair ratio for Technogym.
Result: Price-to-Earnings of 22.1x (ABOUT RIGHT)
Still, Technogym’s premium P/E, combined with the recent share price decline year to date, leaves the story sensitive to any wobble in earnings delivery or demand.
Find out about the key risks to this Technogym narrative.
Another View on Technogym’s Value
The SWS DCF model takes a different angle on Technogym. On those cash flow assumptions, the shares at €12.95 trade around 15.7% below an estimated fair value of €15.36, which points to an undervalued reading rather than a stretched one. Which signal do you give more weight to when the market is this split?
Look into how the SWS DCF model arrives at its fair value.
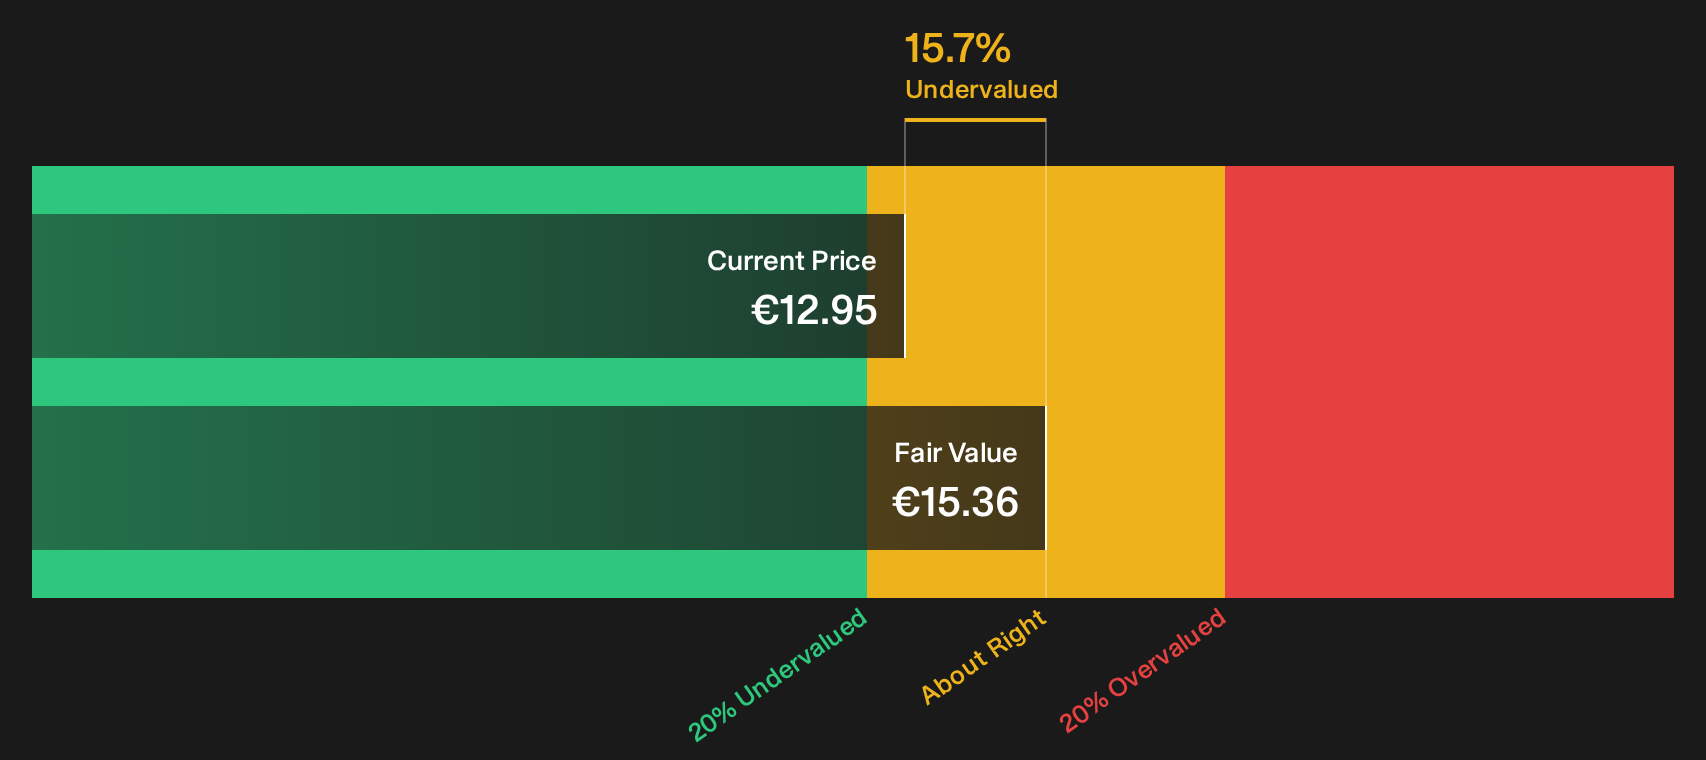
Simply Wall St performs a discounted cash flow (DCF) on every stock in the world every day (check out Technogym for example). We show the entire calculation in full. You can track the result in your watchlist or portfolio and be alerted when this changes, or use our stock screener to discover 190 high quality undervalued stocks. If you save a screener we even alert you when new companies match - so you never miss a potential opportunity.
Next Steps
With Technogym attracting both concerns and optimism, you do not need to sit on the sidelines. Weigh the full picture for yourself by reviewing 3 key rewards and 1 important warning sign.
Looking for more Technogym‑style investment ideas?
Do not stop with Technogym. The same tools that surface this story can help you spot other opportunities before they feel crowded.
- Target quality at a discount by checking companies that currently screen as 190 high quality undervalued stocks.
- Build staying power into your portfolio by reviewing a list of solid balance sheet and fundamentals (204 results).
- Get ahead of the crowd by scanning 614 high quality undiscovered gems that still fly under most investors’ radar.
This article by Simply Wall St is general in nature. We provide commentary based on historical data and analyst forecasts only using an unbiased methodology and our articles are not intended to be financial advice. It does not constitute a recommendation to buy or sell any stock, and does not take account of your objectives, or your financial situation. We aim to bring you long-term focused analysis driven by fundamental data. Note that our analysis may not factor in the latest price-sensitive company announcements or qualitative material. Simply Wall St has no position in any stocks mentioned.
Have feedback on this article? Concerned about the content? Get in touch with us directly. Alternatively, email editorial-team@simplywallst.com