


Standex International (SXI) Could Be 22% Undervalued On Its Engineered Components Story
Recent trading in Standex International (SXI) has drawn attention after a pullback of about 7% over the past week, even though the share price remains higher for the year and the recent quarter.
At a share price of $264.94, Standex International has given investors a 17.82% year to date share price return. The 1 year total shareholder return of 14.09% and 5 year total shareholder return of 156.97% point to strong longer term gains despite the recent loss of momentum.
Scan beyond Standex International's recent pullback and compare it with hand-picked industrial peers by reviewing the list of solid balance sheet and fundamentals (25 results) that are holding up under pressure.
Bulls see the recent 7% pullback in Standex International as a chance to own a diversified industrial at a cheaper entry point. Bears argue the run in longer term returns leaves little margin for error. Which side do the current valuation markers support?
Most Popular Narrative: 22% Undervalued
On the most followed view of Standex International, the gap between the $338.40 fair value estimate and the $264.94 last close frames the recent pullback as a pricing question rather than a business reset. That narrative leans heavily on grid, aerospace and electronics earnings power to justify the difference.
The main thing that has to go right is successful execution of Standex International’s shift toward higher margin engineered components and grid capacity expansion. This includes delivering on targeted grid sales of roughly US$340 million to US$440 million by fiscal 2030, while sustaining new product launches and margin expansion.
See why 1 investors see Standex International as 22% undervalued.
Result: Fair Value of $338.40 (UNDERVALUED)
Still, this bullish Standex International story weakens quickly if organic growth in Electronics and Aerospace & Defense cools, or if new grid projects earn below past returns.
Find out about the key risks to this Standex International narrative.
Another View On Standex International’s Valuation
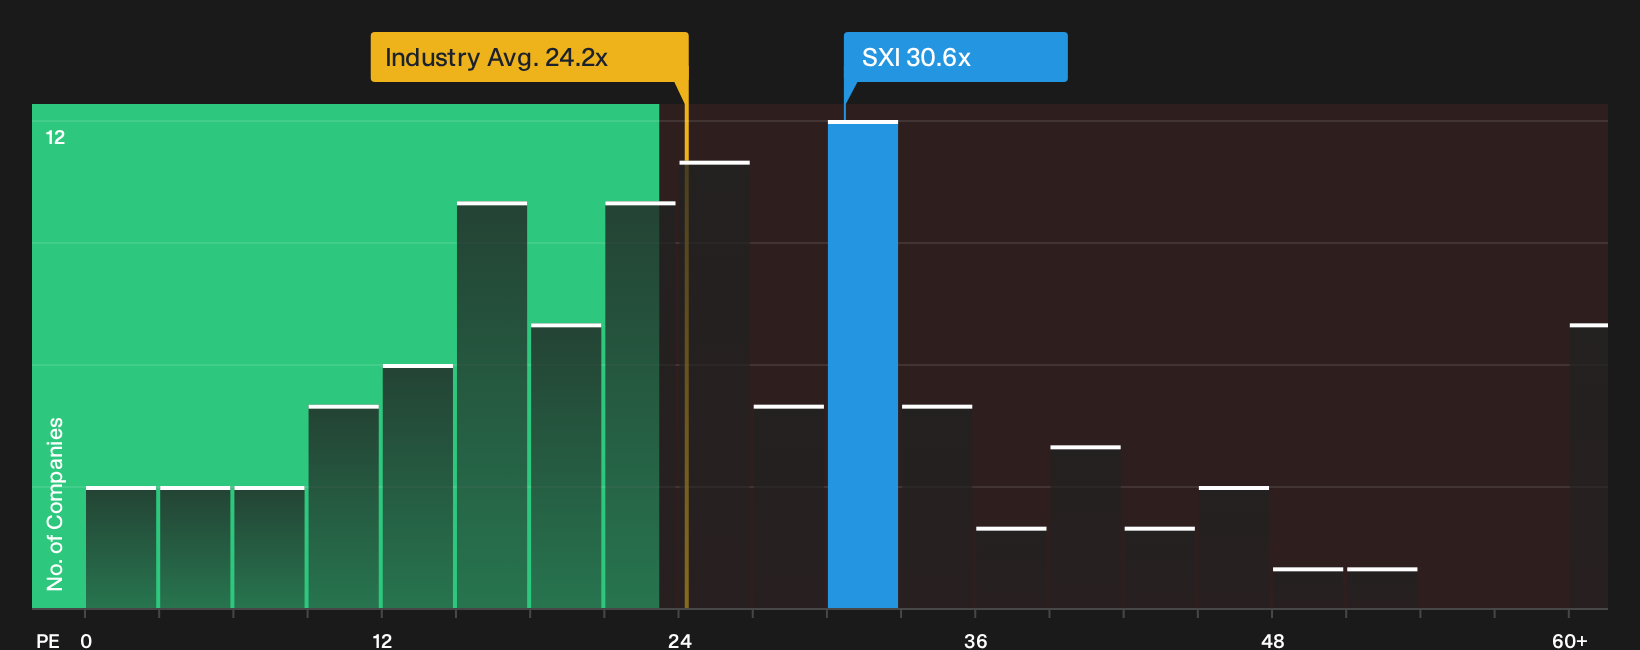
There is a different read on Standex International when looking at plain P/E figures. The shares trade at 30.6x earnings, compared with 24.2x for the US Machinery group and a fair ratio of 20.8x. That gap points to higher valuation risk if growth or margins slip.
To see how those earnings multiples compare with the underlying business metrics, take a closer look at the full valuation breakdown in the See what the numbers say about this price — find out in our valuation breakdown..
Next Steps
Mixed messages in Standex International's story, with both concern and optimism in the data, make this a moment to look closely and move with intention. To evaluate both sides of that debate based on the underlying numbers, start by reviewing the 3 key rewards and 3 important warning signs.
Looking for more Standex International style investment ideas?
If Standex International has your attention, do not stop here. Use this moment to widen your watchlist with assets that match your risk and return preferences.
- Target potential upside with companies that pair quality fundamentals with pricing that still looks reasonable through the 33 high quality undervalued stocks.
- Strengthen your income stream by focusing on businesses that aim for reliable, higher yields through the 8 dividend fortresses.
- Protect the downside by focusing on financially resilient operators identified in the 32 resilient stocks with low risk scores.
This article by Simply Wall St is general in nature. We provide commentary based on historical data and analyst forecasts only using an unbiased methodology and our articles are not intended to be financial advice. It does not constitute a recommendation to buy or sell any stock, and does not take account of your objectives, or your financial situation. We aim to bring you long-term focused analysis driven by fundamental data. Note that our analysis may not factor in the latest price-sensitive company announcements or qualitative material. Simply Wall St has no position in any stocks mentioned.
Have feedback on this article? Concerned about the content? Get in touch with us directly. Alternatively, email editorial-team@simplywallst.com