


Why Did Lumine Group (TSXV:LMN) Stock Climb After Its Latest Update?
Lumine Group (TSXV:LMN) reported a 28% year-over-year revenue increase for the second quarter, largely tied to acquisitions, and secured two additional media supply chain deals after quarter end, sharpening investor focus on integration risks.
Lumine Group’s recent 3.15% 1-day share price return and 12.58% 7-day share price gain suggest investors are reacting positively to the Q2 revenue update and new deals, even though the year-to-date share price return is down 7.89% and the 1-year total shareholder return has declined 29.06%, while the 3-year total shareholder return of 40.43% points to a materially stronger longer-term record.
Scan how Lumine Group’s acquisitive playbook compares with other software firms pursuing growth through deals by reviewing the 10 high quality undiscovered gems with strong fundamentals that may still be under the radar.
Lumine Group appears to be a solid communications software platform with acquisitive momentum, yet the share price is still down sharply over the past year. Are investors looking at a mispriced compounder, or is this a value trap in the making?
Price-to-Earnings of 40.8x: Is it justified?
Lumine Group trades on a P/E of 40.8x, which is below one peer group but above several benchmarks, so the current CA$24.87 share price sits in an awkward middle ground that investors may want to examine carefully.
The P/E ratio compares the stock price with earnings per share and effectively shows how many dollars investors are paying for each dollar of profit. For a software business like Lumine Group, where earnings and cash flows can compound over time, a richer multiple can sometimes reflect expectations for continued expansion rather than just today's profitability.
Here, LMN is described as good value when stacked against a peer average P/E of 60.4x, which points to investors paying a lower price for each unit of earnings than some comparable software firms. At the same time, the estimate of a fair P/E of 28.7x signals that the current 40.8x appears expensive relative to what the SWS fair ratio suggests the market could gravitate toward if sentiment or growth expectations change.
Against the broader North American Software industry average P/E of 31.2x, Lumine Group carries a meaningfully higher earnings multiple, so the market is assigning a premium that assumes its 26.3% forecast revenue growth and 19.5% expected annual earnings expansion support that higher price level.
Explore the SWS fair ratio for Lumine Group.
Result: Price-to-Earnings of 40.8x (OVERVALUED)
Still, Lumine Group’s rich 40.8x P/E and acquisitive tilt leave little margin for error if deal integration disappoints or growth expectations cool quickly.
Find out about the key risks to this Lumine Group narrative.
Another View: What The SWS DCF Model Says
The P/E workup presents Lumine Group as expensive, yet the SWS DCF model points in the opposite direction. At CA$24.87, the stock is assessed as trading below an estimated future cash flow value of CA$50.60. On that basis, it appears undervalued from a discounted cash flow perspective. Which signal should you weigh more heavily?
Look into how the SWS DCF model arrives at its fair value.
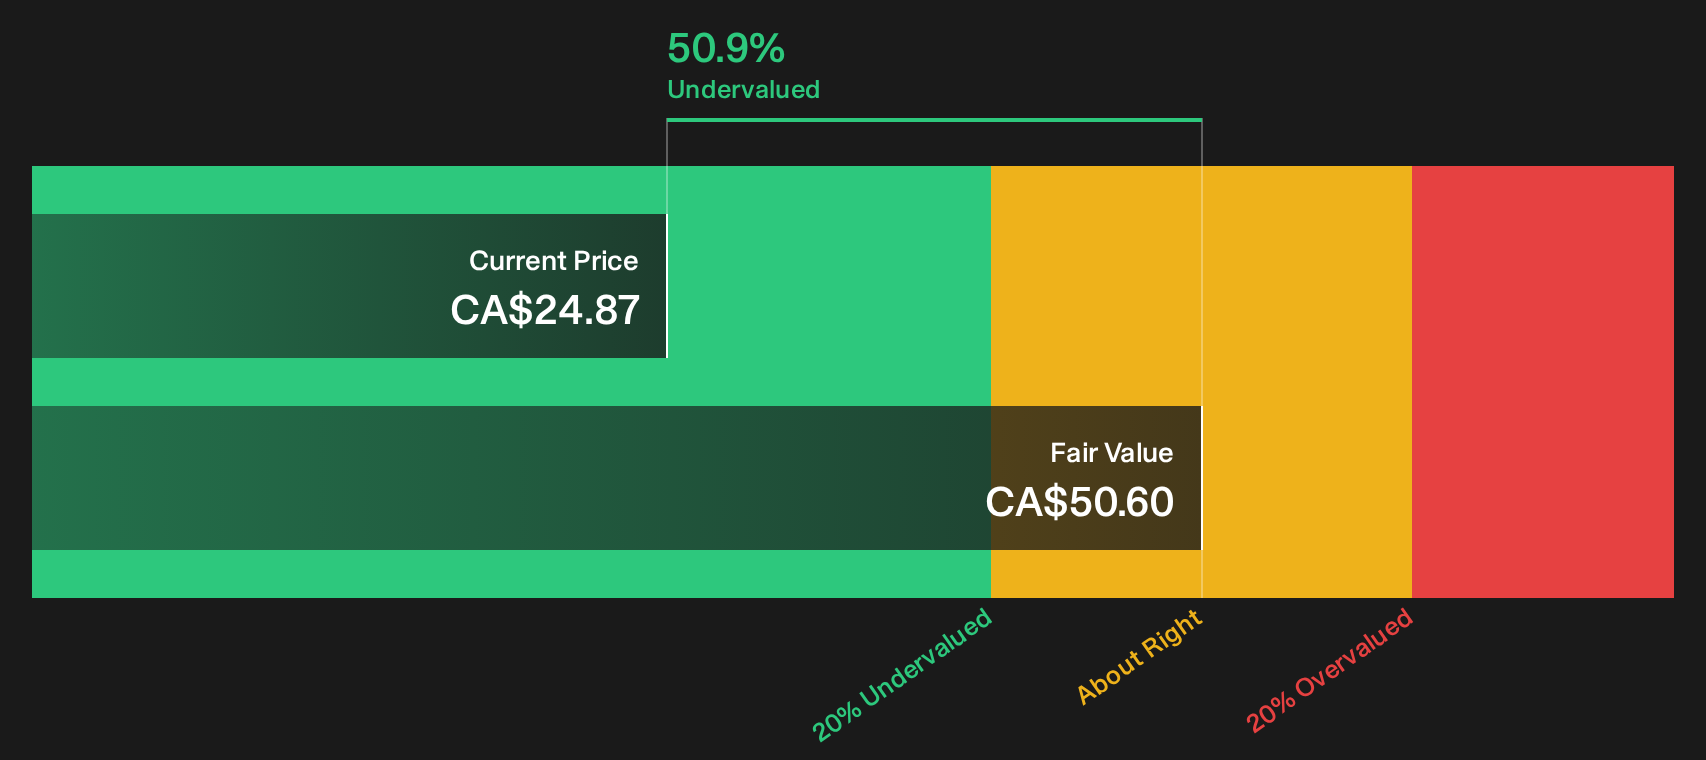
Simply Wall St performs a discounted cash flow (DCF) on every stock in the world every day (check out Lumine Group for example). We show the entire calculation in full. You can track the result in your watchlist or portfolio and be alerted when this changes, or use our stock screener to discover 5 high quality undervalued stocks. If you save a screener we even alert you when new companies match - so you never miss a potential opportunity.
Next Steps
Faced with mixed signals on Lumine Group, you do not need to wait for consensus to form. You can act quickly by reviewing the upside drivers investors already highlight in the 3 key rewards.
Looking for more Lumine Group investment ideas?
If you want to stress test your view on Lumine Group, comparing it with targeted stock ideas can sharpen your next move and surface options you might be missing.
- Target resilient balance sheets by scanning the list of solid balance sheet and fundamentals (8 results) and see which companies pair financial strength with durable fundamentals.
- Zero in on potential mispricings by reviewing the 5 high quality undervalued stocks and compare their metrics with what you see at Lumine Group.
- Spot differentiated growth stories early by checking the 10 high quality undiscovered gems before the broader market starts paying attention.
This article by Simply Wall St is general in nature. We provide commentary based on historical data and analyst forecasts only using an unbiased methodology and our articles are not intended to be financial advice. It does not constitute a recommendation to buy or sell any stock, and does not take account of your objectives, or your financial situation. We aim to bring you long-term focused analysis driven by fundamental data. Note that our analysis may not factor in the latest price-sensitive company announcements or qualitative material. Simply Wall St has no position in any stocks mentioned.
Have feedback on this article? Concerned about the content? Get in touch with us directly. Alternatively, email editorial-team@simplywallst.com