


CNA Financial (CNA) Pullback Puts Its Value Case Back In Focus
CNA Financial (CNA) traded at US$47.90 at the last close, catching investor attention after fresh performance data showed a mixed picture across recent periods and raised new questions about how to frame the insurer’s valuation.
CNA Financial’s recent bounce, including a 1-day share price return of 1.25% and a 7-day share price return of 3.75%, comes after a 90-day share price decline of 9.47%. The 1-year total shareholder return of 14.15% signals that longer term momentum has been stronger than the short term pullback.
Scan other insurers showing similar mixed momentum to CNA Financial by checking out 32 resilient stocks with low risk scores, which features companies with resilient balance sheets and more measured price swings.
For CNA Financial, a history of loyal long-term returns combined with a recent pullback sets up a clear split. Is this a case of underlying price strength, or a warning sign once valuation is examined more closely?
Price-to-Earnings of 10.5x: Is it justified?
CNA Financial screens as inexpensive on traditional metrics, with the stock trading on a P/E of 10.5x at a last close of $47.90 while still being flagged as good value on several different checks.
The P/E ratio compares what investors are paying today for each dollar of CNA Financial’s earnings. It is a common yardstick for mature insurers where profitability and underwriting discipline matter more than rapid expansion.
CNA is described as good value versus the peer average P/E of 15.6x and also versus the broader US Insurance industry at 11x, which points to the market assigning a clear discount to its earnings. The estimated fair P/E of 10.6x is very close to the current 10.5x figure. This indicates that the present level is near the range that regression analysis suggests the market could reasonably move towards.
Explore the SWS fair ratio for CNA Financial.
Result: Price-to-Earnings of 10.5x (UNDERVALUED)
Still, CNA Financial carries clear risks for this thesis, including its run-off long-term care book and any shift in pricing across commercial and specialty lines.
Find out about the key risks to this CNA Financial narrative.
Another view on CNA Financial’s value
The P/E points to CNA Financial as inexpensive. A different lens tells an even stronger story. Our DCF model estimates future cash flow value at $85.21 per share, which is well above the recent $47.90 price and flags the stock as undervalued.
This gap gives long term investors more room for error if business conditions soften, yet it also raises a simple question. Is the discount compensation for the long term care run off risk and modest forecast earnings growth, or is the market underpricing those cash flows?
Look into how the SWS DCF model arrives at its fair value.
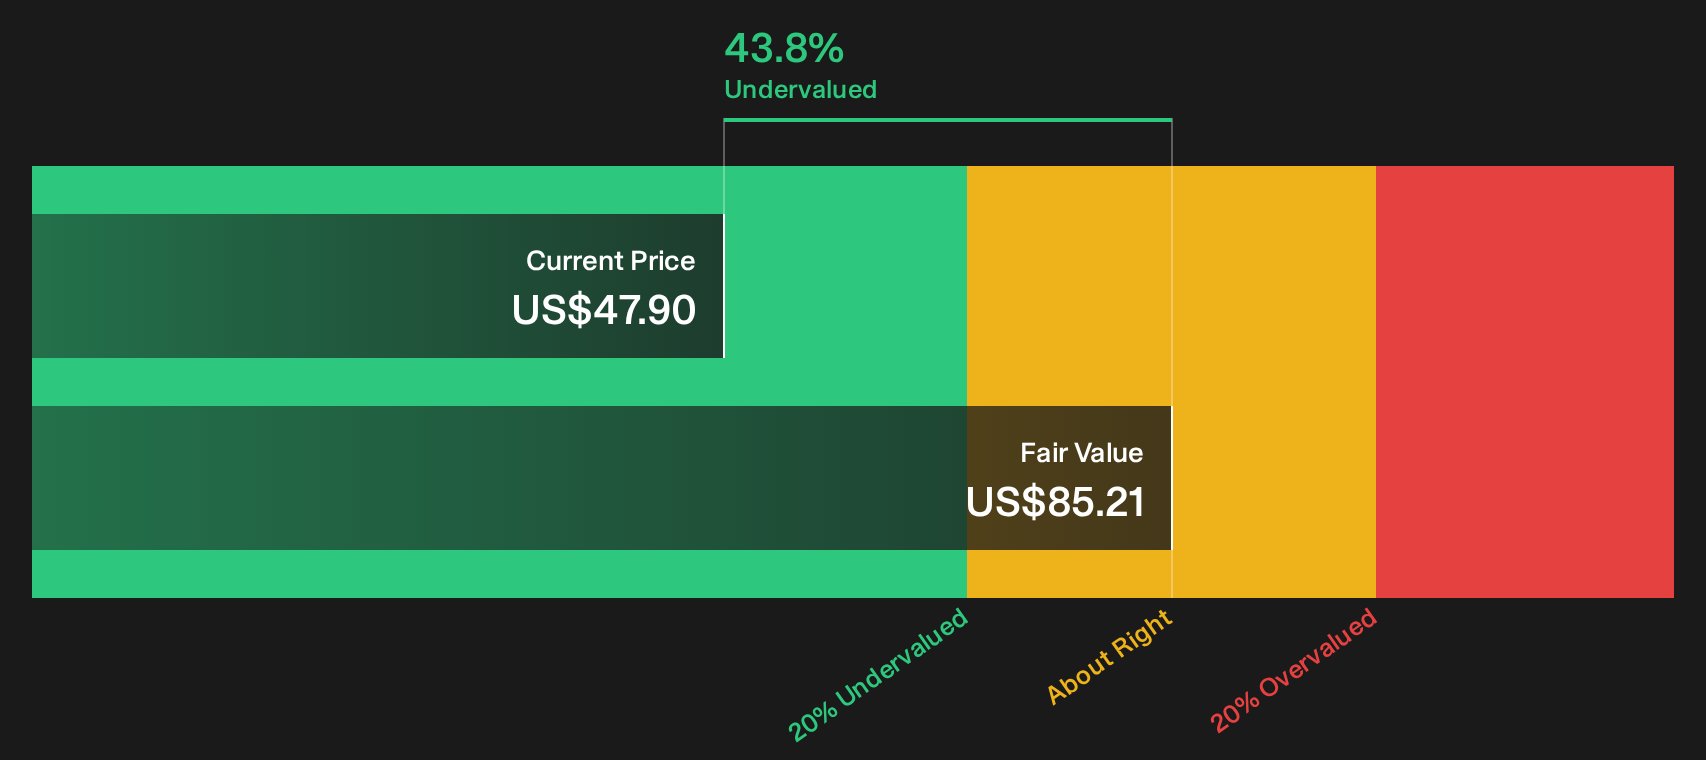
Simply Wall St performs a discounted cash flow (DCF) on every stock in the world every day (check out CNA Financial for example). We show the entire calculation in full. You can track the result in your watchlist or portfolio and be alerted when this changes, or use our stock screener to discover 33 high quality undervalued stocks. If you save a screener we even alert you when new companies match - so you never miss a potential opportunity.
Next Steps
Mixed signals on CNA Financial’s valuation and risk profile can be confusing, so review the underlying data and pressure test the story for yourself using the 4 key rewards and 2 important warning signs.
Looking for more investment ideas beyond CNA Financial?
If CNA Financial has sharpened your focus on value and risk, do not stop here. Broader idea generation helps you spot opportunities before the crowd.
- Target resilient balance sheets and steadier price action by scanning the list of solid balance sheet and fundamentals (25 results) for companies built to handle tougher conditions.
- Hunt for mispriced opportunities by reviewing the 33 high quality undervalued stocks that pair quality fundamentals with valuations that still look appealing.
- Build a cash-generating watchlist by checking out the 8 dividend fortresses that combine higher yields with more established operations.
This article by Simply Wall St is general in nature. We provide commentary based on historical data and analyst forecasts only using an unbiased methodology and our articles are not intended to be financial advice. It does not constitute a recommendation to buy or sell any stock, and does not take account of your objectives, or your financial situation. We aim to bring you long-term focused analysis driven by fundamental data. Note that our analysis may not factor in the latest price-sensitive company announcements or qualitative material. Simply Wall St has no position in any stocks mentioned.
Have feedback on this article? Concerned about the content? Get in touch with us directly. Alternatively, email editorial-team@simplywallst.com