


Cognex (CGNX) Stock Looks Fully Priced Following Its 51% 3 Year Run
Cognex has delivered a 51.3% gain over the past 3 years, yet recent weekly and monthly declines now have investors asking whether the current US$53.99 share price still lines up with what its earnings can reasonably support. With that kind of swing in the rear-view mirror, along with a sharp pullback in the short term, the key issue is how much of its earnings power is already built into today's valuation.
- The 51.3% return over 3 years puts real weight on the question of how much earnings strength the market is already paying for in Cognex stock.
- The business relies heavily on converting its vision technology into consistent profits, which can shape how investors judge the durability and quality of its earnings stream.
- Your read on Cognex is one view; the desks covering it have another. See what analysts think Cognex's shares could be worth.
For investors, the debate is whether Cognex's current share price is appropriately grounded in the earnings it produces today and what those profits can realistically support over time.
If you are weighing whether Cognex's recent swings line up with its earnings power, it can help to compare it with other automation and vision plays using a focused list of 91 robotics and automation stocks.
Has Cognex Run Too Far on Earnings?
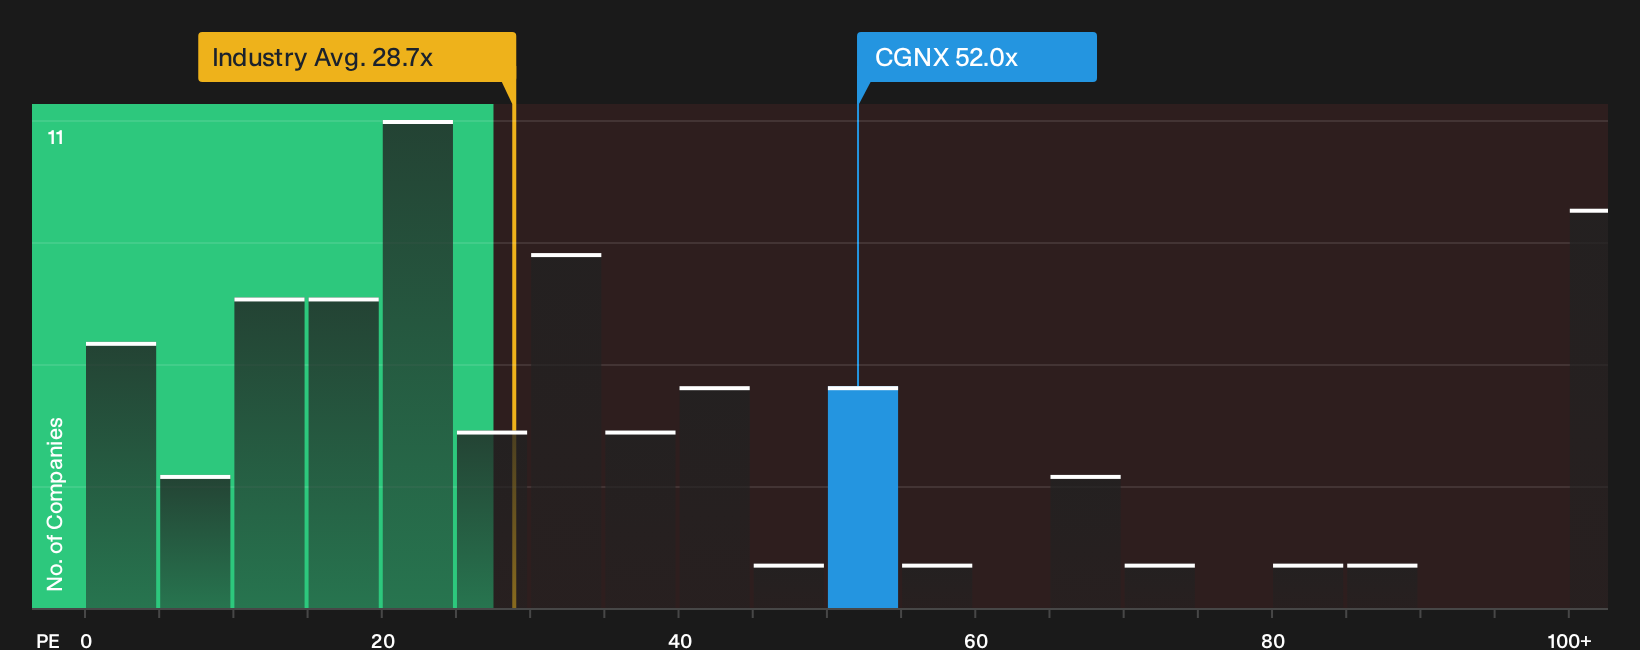
The P/E lens fits Cognex because earnings still sit at the center of how investors judge this automation play. On that metric, the stock trades on a P/E of about 52.0x, which is below the peer group near 76.2x but well above the broader electronic industry around 28.7x. That pattern suggests the market is paying a clear premium to the sector while still pricing Cognex at a discount to more expensive direct rivals in similar niches.
The fair multiple implied by Cognex's own quality and risk profile comes in lower than where the shares trade today. As a result, the current P/E tilts toward overvalued on this framework rather than cheap. For anyone holding or considering the stock, the key question is whether Cognex can keep delivering earnings that justify paying well above the industry level for each dollar of profit. Explore the numbers behind Cognex's P/E valuation.
The Cognex Narrative: What Would Justify Today's Price?
Simply Wall St Narratives pick up where the Cognex valuation puzzle leaves off by spelling out which assumptions on growth, margins and earnings would need to hold for the shares to be worth meaningfully more or less than they trade for today. Each scenario links a fair value estimate to a specific view of Cognex's potential catalysts and risks, so you can track over time which storyline seems closest to reality on the Community page.
One of the top community narratives on Cognex: 32% undervalued
"The current valuation suggests that the market is not fully crediting Cognex for sustaining adjusted EBITDA margins in the high-20s to low-30s range..."
Discover why this Narrative puts Cognex at 32% undervalued.
One more lens for Cognex that sits beyond today's share price
Price multiples tell you what investors are paying today, but the next layer is how professional analysts currently map Cognex a few years out and how that picture lines up with this market tag. Explore where analysts expect Cognex to be in a few years.
This article by Simply Wall St is general in nature. We provide commentary based on historical data and analyst forecasts only using an unbiased methodology and our articles are not intended to be financial advice. It does not constitute a recommendation to buy or sell any stock, and does not take account of your objectives, or your financial situation. We aim to bring you long-term focused analysis driven by fundamental data. Note that our analysis may not factor in the latest price-sensitive company announcements or qualitative material. Simply Wall St has no position in any stocks mentioned.
Have feedback on this article? Concerned about the content? Get in touch with us directly. Alternatively, email editorial-team@simplywallst.com