


SLOMAN NEPTUN Schiffahrts Aktiengesellschaft (HMSE:NEP) H1 Results Meet Stock Indifference
SLOMAN NEPTUN Schiffahrts-Aktiengesellschaft came into this H1 2026 earnings release with a mixed script in investors’ minds. The shipping group had a trailing P/E of 4.4x and a one year share price that slipped about 5.4%, even as trailing net profit margin sat at 17.2%.
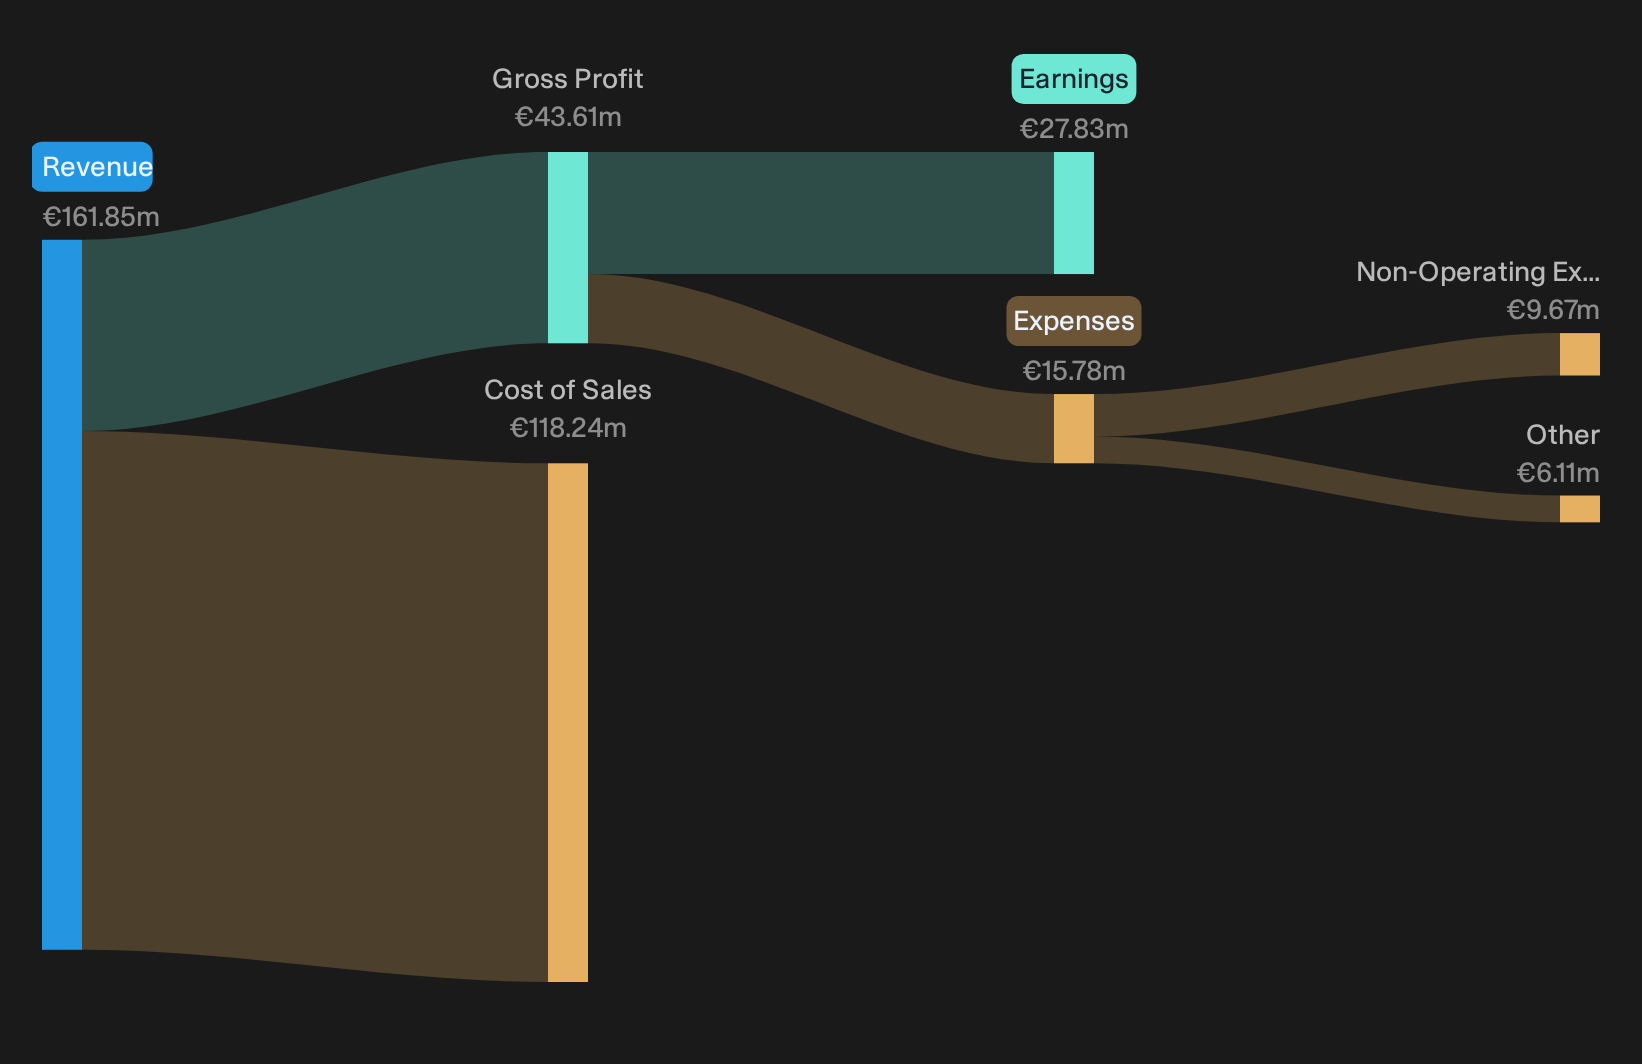
The new half year numbers sharpen that contradiction. Revenue for H1 2026 reached €92.7 million and net income hit €14.7 million, yet the stock closed yesterday at €61 with a flat one week and one month return. The main story is valuation strain, not collapse in operating power.
Love SLOMAN NEPTUN Schiffahrts-Aktiengesellschaft’s 17.2% net margin but uneasy about a 4.4x P/E and a share price that drifted 5.4% over the year? Check your instincts against a curated group of financially stronger peers in our list of solid balance sheet and fundamentals stocks (204 results)
H1 2026 Earnings Summary
- Revenue (H1 2026 vs H1 2025): €92.7 million vs. €72.5 million (higher top line in the latest half year)
- Net Income (Excl. Extra Items, H1 2026 vs H1 2025): €14.7 million vs. a loss of €7.0 million (swing back to profit)
- Basic EPS (H2 2025 vs H1 2025, latest available EPS data): €6.56 vs. a loss of €3.49 per share (return from loss per share to positive earnings)
- Net Profit Margin (Trailing 12 Months vs Prior Year): 17.2% vs. 13.7% (stronger profitability on recent earnings for SLOMAN NEPTUN Schiffahrts-Aktiengesellschaft)
Prefer clean charts instead of another wall of earnings tables and ratios? See SLOMAN NEPTUN Schiffahrts-Aktiengesellschaft’s full valuation picture in a single visual dashboard with our company report for SLOMAN NEPTUN Schiffahrts-Aktiengesellschaft.
Revenue Turnaround Supports SLOMAN NEPTUN Optimists
For anyone leaning positive on SLOMAN NEPTUN Schiffahrts-Aktiengesellschaft, the income statement helps the case. Revenue in H1 2026 of €92.7 million alongside net income of €14.7 million and a trailing net margin of 17.2% presents a business that is currently earning solid money on each euro of sales. The swing from a loss of €7.0 million in the prior half year to profit also fits a recovery lens, especially for a shipping operator that many investors view through a cyclical perspective.
Muted Share Return Keeps Caution Alive
Bears will point straight to the share chart. The stock is flat over 7 and 30 days and has slipped about 5.4% over 90 days, which suggests investors are not rushing to re-rate SLOMAN NEPTUN Schiffahrts-Aktiengesellschaft on these figures alone. The move from loss to profit and a 17.2% trailing margin challenge a thesis built on immediate earnings stress, yet the subdued price reaction keeps concerns around sector cyclicality, sentiment and liquidity in focus.
Muted share performance after a swing from loss to profit can signal deeper issues with capital allocation, cash flow quality or dividend resilience. Review an independent risk analysis for SLOMAN NEPTUN Schiffahrts-Aktiengesellschaft which shows 1 important warning sign to see whether this muted reaction is just the visible part of a wider risk profile.
Hunt Quiet Disconnects In Earnings
SLOMAN NEPTUN Schiffahrts-Aktiengesellschaft reports improving results while its share price response remains muted. The real opportunity is finding stocks that could be undervalued before the market corrects them.
- Company 1 - 23% below our estimate - builds advanced assembly and testing lines supporting more AI focused memory workloads.
- Company 2 - 46% below our estimate - expands high speed networking programs that help hyperscaler clients scale AI infrastructure orders.
- Company 3 - 44% below our estimate - pursues a metals combination integrating mines and smelters to serve energy transition demand.
That is three of the list. See all 187 potentially undervalued companies →
This article by Simply Wall St is general in nature. We provide commentary based on historical data and analyst forecasts only using an unbiased methodology and our articles are not intended to be financial advice. It does not constitute a recommendation to buy or sell any stock, and does not take account of your objectives, or your financial situation. We aim to bring you long-term focused analysis driven by fundamental data. Note that our analysis may not factor in the latest price-sensitive company announcements or qualitative material. Simply Wall St has no position in any stocks mentioned.
Have feedback on this article? Concerned about the content? Get in touch with us directly. Alternatively, email editorial-team@simplywallst.com