


Taikisha (TSE:1979) Pullback Revives Fair Value Debate Following DCF Undervaluation Call
Recent commentary around Taikisha (TSE:1979) centers on a DCF assessment suggesting the construction specialist may trade below estimated intrinsic value. This is drawing fresh attention to the stock’s long run cash flow profile.
At a share price of ¥3,730.0, Taikisha has seen short term momentum soften, with the 30 day share price return down 3.62% and the 90 day share price return down 16.74%. This comes even as the 1 year total shareholder return of 34.61% and 5 year total shareholder return of 167.54% point to a much stronger longer term story that now meets a DCF narrative arguing the stock could still be trading below estimated intrinsic value.
Spot opportunities that rhyme with Taikisha's DCF story by scanning our hand picked 13 high quality undervalued stocks, which combine solid cash generation with balance sheet strength.Taikisha trades at a steep discount to both analyst targets and DCF estimates, even after the recent pullback. Is the market correctly pricing in risk, or is it simply too cautious on this contractor’s cash flows?
Price-to-Earnings of 15.9x: Is it justified for Taikisha?
Taikisha screens as undervalued on a DCF basis, yet on a simpler yardstick like the P/E ratio the picture flips. The stock trades at 15.9x earnings, while our fair P/E indication sits closer to 14x. That gap matters because it shapes how much of the DCF optimism may already be reflected in the share price.
The P/E multiple compares what investors pay for each unit of current profit to both peers and an estimated fair level for this business. For Taikisha, a 15.9x P/E in a construction related field suggests the market is willing to ascribe a richer tag to its earnings than to many domestic competitors. This links to factors such as earnings quality, cash flow visibility and the profile of its order book.
Context against peers sharpens the view. The same 15.9x P/E sits well above the JP Construction industry average of 10.6x and above the 12.8x peer average, which indicates that investors are already assigning a premium to Taikisha’s earnings stream. Compared with the estimated fair P/E of 14x, the current valuation is even further ahead, which points to a level the market could move towards if sentiment or expectations cool.
Explore the SWS fair ratio for Taikisha.
Result: Price-to-earnings of 15.9x (OVERVALUED).
Still, Taikisha relies heavily on construction project demand. Any slowdown in ordering or delays in large contracts could quickly challenge the current valuation premium.
Find out about the key risks to this Taikisha narrative.
Another View On Taikisha’s Value
The P/E premium suggests Taikisha is priced richly, yet the SWS DCF model presents a different perspective. On that cash flow view, the shares trade about 38.5% below an estimated value of ¥6,060.48, which may indicate a mismatch between near term sentiment and long term cash generation.
Look into how the SWS DCF model arrives at its fair value.
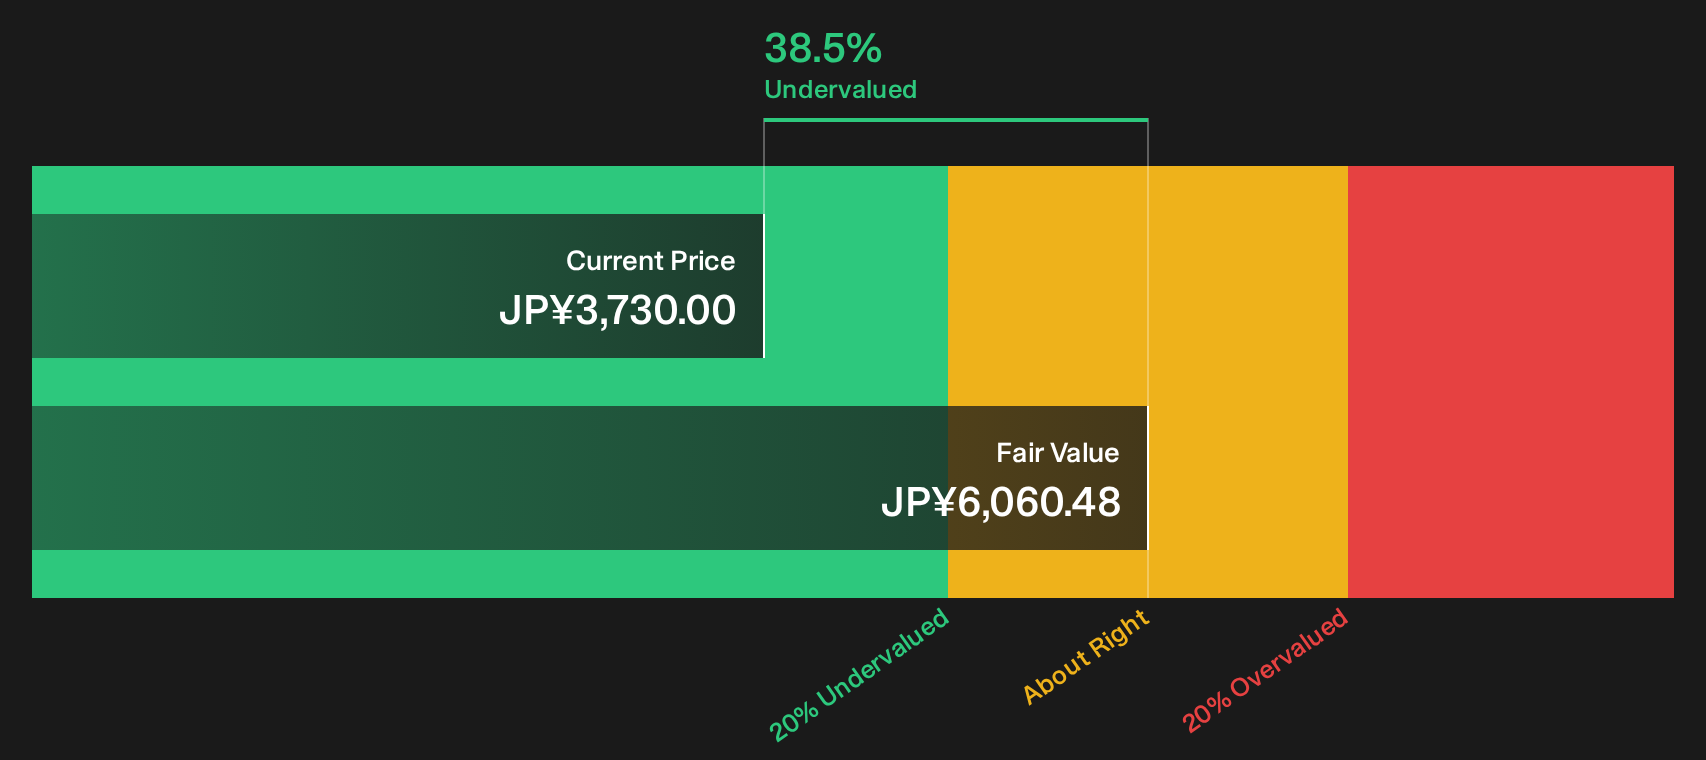
Simply Wall St performs a discounted cash flow (DCF) on every stock in the world every day (check out Taikisha for example). We show the entire calculation in full. You can track the result in your watchlist or portfolio and be alerted when this changes, or use our stock screener to discover 13 high quality undervalued stocks. If you save a screener we even alert you when new companies match - so you never miss a potential opportunity.
Next Steps
The valuation signals point one way, but your conclusion does not have to follow the crowd. Take a fresh look at Taikisha’s numbers, weigh the risks and potential rewards, and then ground your own stance in the underlying data by reviewing the 5 key rewards.
Looking for more investment ideas beyond Taikisha?
If Taikisha has sharpened your focus on valuation, do not stop here. Broader idea flow makes it easier to spot patterns and avoid concentration risk.
- Target dependable cash generators by reviewing the 13 high quality undervalued stocks that pair strong fundamentals with valuations that may leave room for upside.
- Prioritise peace of mind and capital resilience with a 23 resilient stocks with low risk scores that filters for businesses scoring well on financial stability.
- Hunt for future leaders early by scanning a 73 high quality undiscovered gems where solid quality metrics have yet to attract broad attention.
This article by Simply Wall St is general in nature. We provide commentary based on historical data and analyst forecasts only using an unbiased methodology and our articles are not intended to be financial advice. It does not constitute a recommendation to buy or sell any stock, and does not take account of your objectives, or your financial situation. We aim to bring you long-term focused analysis driven by fundamental data. Note that our analysis may not factor in the latest price-sensitive company announcements or qualitative material. Simply Wall St has no position in any stocks mentioned.
Have feedback on this article? Concerned about the content? Get in touch with us directly. Alternatively, email editorial-team@simplywallst.com