


How Investors May Respond To PAL GROUP Holdings (TSE:2726) Half Year Results
- PAL GROUP Holdings reported half year results for the period ended August 31, 2026, with sales of JPY 121,931 million and net income of JPY 9,428 million, translating into basic earnings per share of JPY 54.36 from continuing operations.
- The combination of sizeable half year sales and positive earnings per share gives investors information on how PAL GROUP Holdings is converting its retail footprint and cost structure into bottom line profitability during this period.
- The focus now turns to how PAL GROUP Holdings' JPY 9,428 million interim net income may influence the investment narrative around the stock.
What Is PAL GROUP Holdings' Investment Narrative?
To own PAL GROUP Holdings, you need to believe its mix of apparel and general merchandise can keep pulling solid earnings out of a Japan focused footprint without constant heavy reinvestment. The half year figures, with ¥121,931 million in sales and ¥9,428 million in profit, support a story about operations that convert store traffic and merchandising into cash flow. In the short term, the key swing factors remain execution in stores, product appeal and how tightly costs are held, rather than any single data point in this set of results.
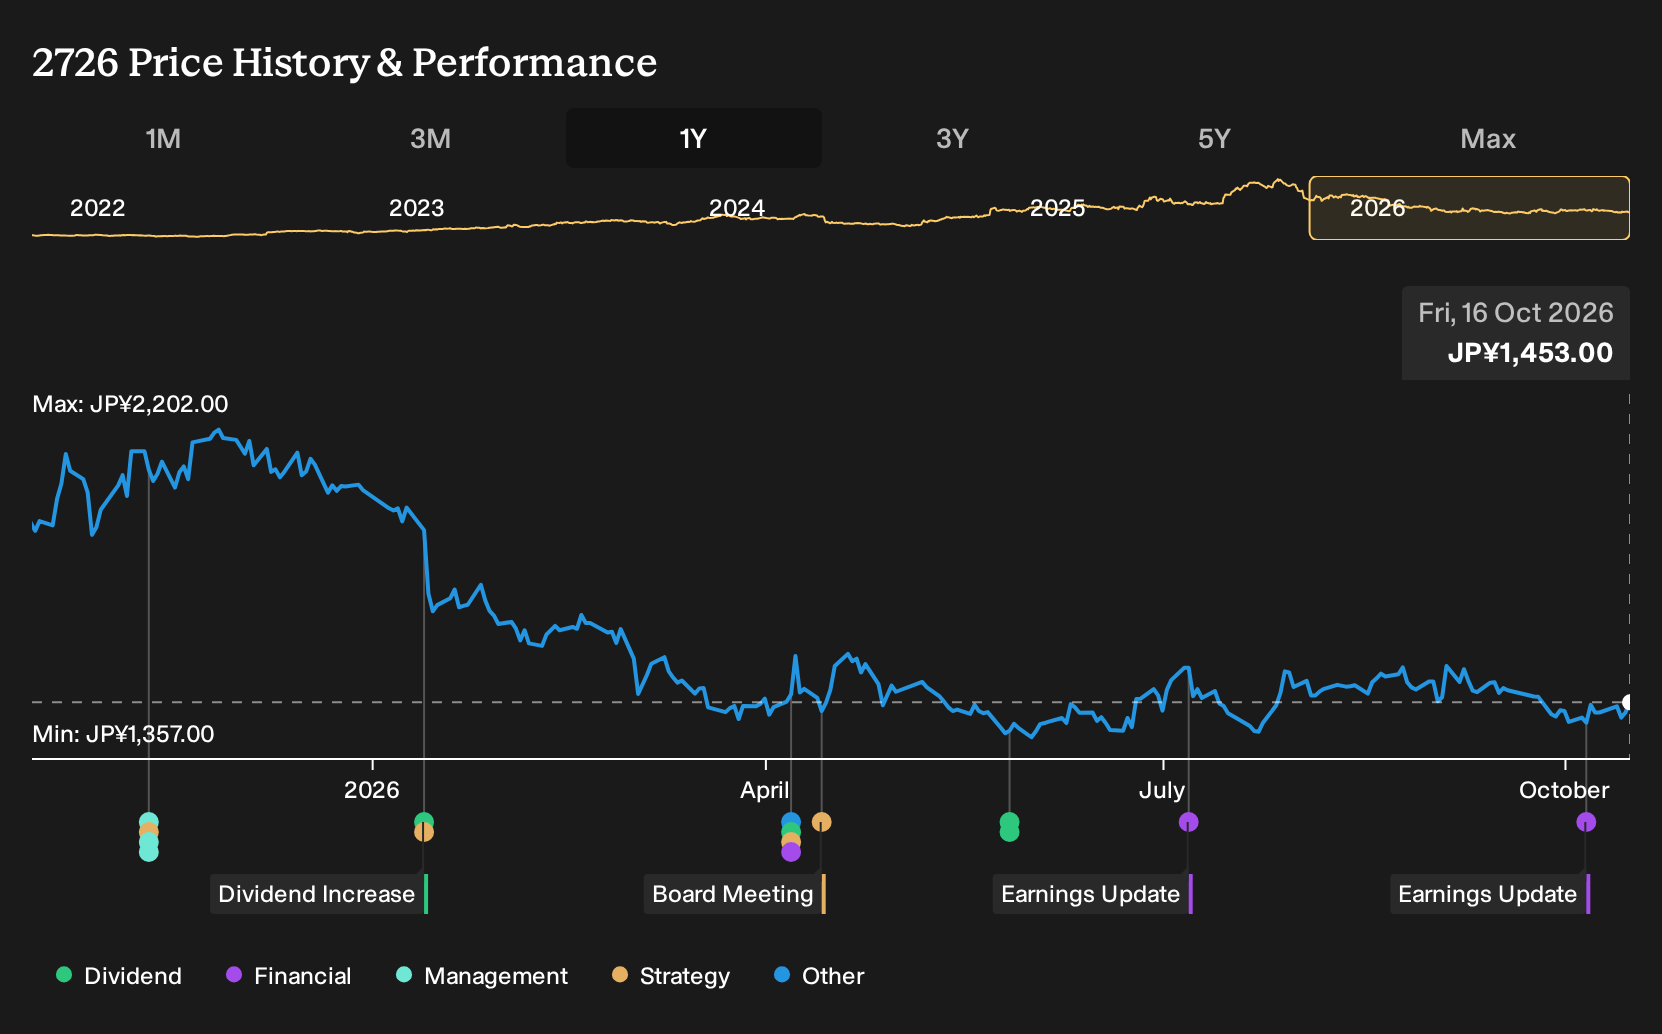
Share performance has been mixed, with a decline of 26.8% year to date but a gain of 2.6% over 90 days. This suggests the latest earnings are not rewriting the story overnight. What they do is keep the profit growth narrative intact in a business already flagged for high quality earnings, improved net margins and return on equity of 21.4%. Against that backdrop, a 2.75% dividend and a P/E of 14x give income and value focused holders a clearer operational base case to work from, even if the stock still underperformed the broader Japanese market over the past year.
That said, there is a pressure point in the PAL GROUP Holdings story that could matter far more if ...
There's only one way to know the right time to buy, sell or hold PAL GROUP Holdings. Head to Simply Wall St's company report for the latest analysis of PAL GROUP Holdings's Fair Value.
Exploring Other Perspectives
PAL GROUP Holdings sits at the center of two fair value views from the Simply Wall St Community, ranging from ¥1,962.5 to ¥2,894.09 across ten tightly packed buckets. Those private forecasts reflect different growth assumptions. Use them as a starting grid, then layer on your own assessment of execution risk and consumer demand resilience.
Explore another PAL GROUP Holdings fair value estimate, including one that suggests it could be worth just ¥1962!
The Verdict Is Yours
Don't just follow the ticker. Dig into the data and build a conviction that's truly your own.
- A great starting point for your PAL GROUP Holdings research is our analysis highlighting 5 key rewards that could impact your investment decision.
- See our latest analysis for PAL GROUP Holdings. The report includes a comprehensive fundamental analysis summarized in a single visual, the Snowflake, making it easy to evaluate PAL GROUP Holdings' overall financial health at a glance.
Looking For More Investment Ideas Beyond PAL GROUP Holdings?
If PAL GROUP Holdings has sharpened your appetite for quality research, use that momentum to scan the wider market and build a watchlist that actually fits your goals. The Simply Wall St Screener lets you filter by fundamentals, balance sheet strength and income profile so you can quickly move from reading about one stock to comparing dozens on the same metrics.
- For potential value opportunities with resilient fundamentals, start with companies screened as 14 high quality undervalued stocks that already show solid cash generation and balance sheet strength.
- If capital preservation and steadier profiles matter most to you, focus on businesses selected as 22 resilient stocks with low risk scores that score well on financial health and risk checks.
- Income focused readers can widen their watchlist by scanning 29 dividend fortresses that combine higher yields with robust fundamentals.
This article by Simply Wall St is general in nature. We provide commentary based on historical data and analyst forecasts only using an unbiased methodology and our articles are not intended to be financial advice. It does not constitute a recommendation to buy or sell any stock, and does not take account of your objectives, or your financial situation. We aim to bring you long-term focused analysis driven by fundamental data. Note that our analysis may not factor in the latest price-sensitive company announcements or qualitative material. Simply Wall St has no position in any stocks mentioned.
Have feedback on this article? Concerned about the content? Get in touch with us directly. Alternatively, email editorial-team@simplywallst.com