


Glory (TSE:6457) Moved Sharply, What Is Catching Investors' Attention?
Recent price action in Glory (TSE:6457) has turned heads, with the stock moving sharply over the past month and the past 3 months. That shift puts the cash-handling specialist back under closer investor scrutiny.
Behind that short burst of strength, momentum in Glory has been building for much longer. A 30-day share price return of 14.41% and a 1-year total shareholder return of 44.56% have contributed to a 5-year total shareholder return of 147.37%.
See how Glory's recent share price burst compares with other companies that have rising momentum and solid fundamentals by checking the curated 73 high quality undiscovered gems list.
Glory now trades above the average analyst target, yet still screens at an estimated 20% discount to intrinsic value. Is the market being too cautious after this run, or is that gap there for a reason?
Price-to-Earnings of 15.4x: Is it justified?
Glory looks expensive on the preferred yardstick. The shares closed at ¥5,033, while the current P/E ratio of 15.4x screens higher than both peers and the wider machinery group.
P/E compares what investors are paying today for each unit of current earnings. For a cash handling equipment specialist like Glory, that metric often reflects how sustainably the market views its profit stream and how much confidence there is in future earnings growth.
Here the valuation is demanding. Glory trades on 15.4x earnings, which is richer than the peer average of 13.2x and also above the JP Machinery industry at 12.8x. It is also above the estimated fair P/E of 13.8x, suggesting the market is pricing in stronger conditions than the regression based fair ratio implies and leaving limited room if growth or profitability softens.
Explore the SWS fair ratio for Glory.
Result: Price-to-Earnings of 15.4x (OVERVALUED)
Still, the Glory story can change quickly if cash handling demand weakens faster than expected, or if overseas operations face tougher competitive or regulatory pressure.
Find out about the key risks to this Glory narrative.
Another view on Glory's value
The P/E screen paints Glory as expensive, yet our DCF model points in the opposite direction. From that perspective, the shares at ¥5,033 trade around 20.4% below an estimated future cash flow value of ¥6,319.08. Which signal do you treat as the anchor?
Look into how the SWS DCF model arrives at its fair value.
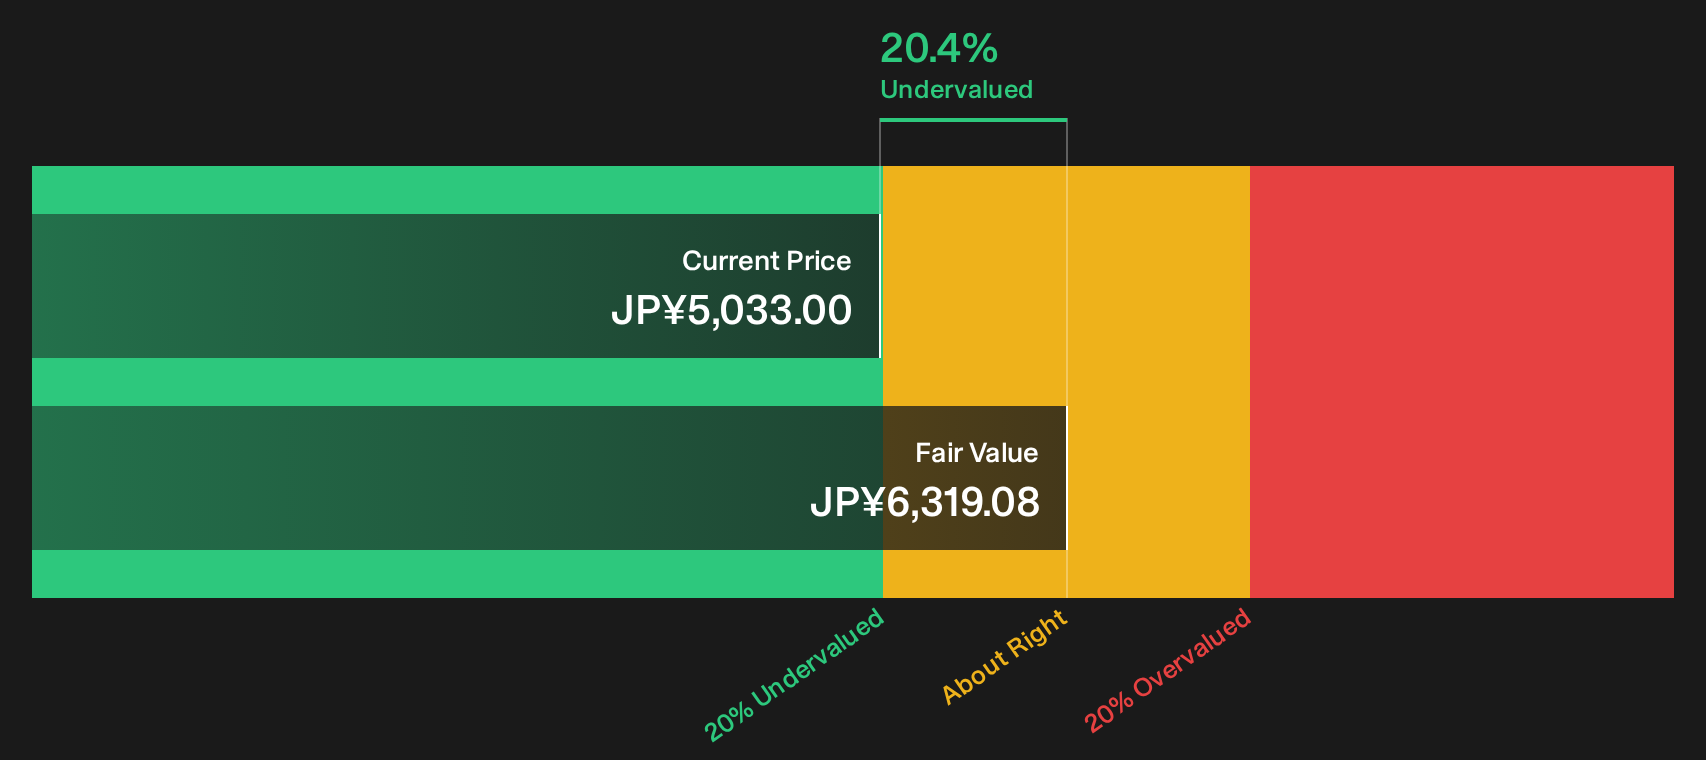
Simply Wall St performs a discounted cash flow (DCF) on every stock in the world every day (check out Glory for example). We show the entire calculation in full. You can track the result in your watchlist or portfolio and be alerted when this changes, or use our stock screener to discover 14 high quality undervalued stocks. If you save a screener we even alert you when new companies match - so you never miss a potential opportunity.
Next Steps
Mixed signals around Glory's valuation and sentiment only matter if you test them yourself and act while the information is still fresh. To see how the upside and downside compare, review the 3 key rewards and 1 important warning sign
Looking for more investment ideas beyond Glory?
If you stop with Glory, you only see part of the opportunity set. Cast the net wider now so you are not chasing crowded trades later.
- Target steady compounding potential by focusing on companies that pair quality with attractive pricing through the 14 high quality undervalued stocks.
- Prioritise resilience and sleep-at-night holdings by scanning the 22 resilient stocks with low risk scores and filtering for businesses with stronger risk profiles.
- Hunt for financially healthy opportunities before they hit everyone’s radar by running the list of solid balance sheet and fundamentals (21 results).
This article by Simply Wall St is general in nature. We provide commentary based on historical data and analyst forecasts only using an unbiased methodology and our articles are not intended to be financial advice. It does not constitute a recommendation to buy or sell any stock, and does not take account of your objectives, or your financial situation. We aim to bring you long-term focused analysis driven by fundamental data. Note that our analysis may not factor in the latest price-sensitive company announcements or qualitative material. Simply Wall St has no position in any stocks mentioned.
Have feedback on this article? Concerned about the content? Get in touch with us directly. Alternatively, email editorial-team@simplywallst.com