


Tritax Big Box REIT (LSE:BBOX) Names A New Chair And Confirms Dividend, Is It Fully Priced?
Tritax Big Box REIT (LSE:BBOX) just paired a boardroom handover with fresh income news, declaring a 2.00 pence interim dividend and confirming Nick Prettejohn as Chair Designate from January 2027.
The Tritax Big Box REIT share price has softened over the past quarter, with a 90 day share price return of 13.58% in the red. However, the 1 year total shareholder return of 4.99% and the 3 year total shareholder return of 26.37% point to a steadier longer term story. The latest governance change and dividend affirmation arrive as investors weigh whether recent weakness signals improving value or rising risk.
Compare Tritax Big Box REIT’s boardroom shift and dividend stance with other income-focused real estate plays by scanning our hand-picked 2 dividend fortresses that may suit a similar dividend-first approach.
Recent share weakness, alongside rising revenue and net income, creates a clear tension. Are investors reassessing Tritax Big Box REIT’s fundamentals, or simply reacting to sentiment as valuation moves next into focus?
Price-to-Earnings of 15.5x: Is it justified?
Tritax Big Box REIT closed at £1.45 with the shares trading on a P/E of 15.5x, which sits slightly above the global industrial REITs average but below its closer peer group, so the market is assigning a mid range earnings multiple to the stock.
The P/E ratio compares what investors are paying for each pound of current earnings. For a logistics focused landlord like Tritax Big Box REIT, it offers a quick indication of how the market weighs today’s income stream against potential future cash generation from long leases, development land and the emerging data center pipeline.
At 15.5x earnings, the shares change hands at a small premium to the estimated fair P/E of 15.3x and to the wider industrial REITs industry. This suggests the market is willing to pay slightly more than that fair ratio level for Tritax Big Box REIT’s earnings profile, yet still at a clear discount to the 20.2x peer average where similar stocks trade on meaningfully richer multiples.
Explore the SWS fair ratio for Tritax Big Box REIT.
Result: Price-to-Earnings of 15.5x (ABOUT RIGHT)
Still, Tritax Big Box REIT faces clear swing factors if sentiment sours around data center execution, or if long lease tenants begin to reset space needs.
Find out about the key risks to this Tritax Big Box REIT narrative.
Another View: Tritax Big Box REIT Through The SWS DCF Lens
The first pass using the P/E ratio paints Tritax Big Box REIT as only slightly expensive against its fair ratio. A different picture appears when using our DCF model. At £1.45, the shares trade around 14.1% below an estimated future cash flow value of £1.68. This frames recent weakness as a potential valuation gap rather than pure downside. Which signal do you weigh more heavily: the modest premium to the fair ratio, or the discount implied by future cash flows?
Look into how the SWS DCF model arrives at its fair value.
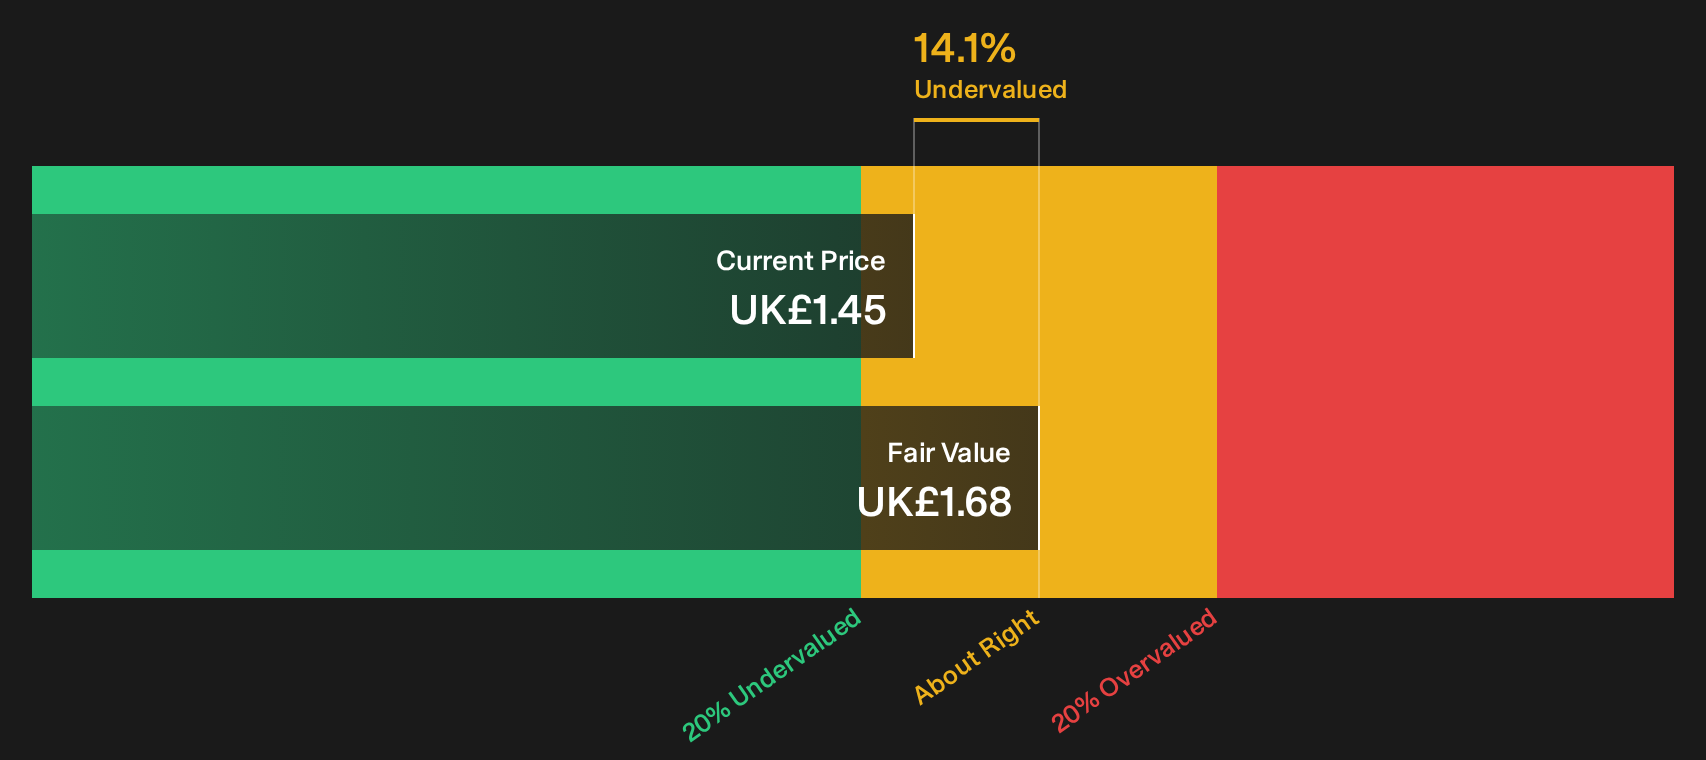
Simply Wall St performs a discounted cash flow (DCF) on every stock in the world every day (check out Tritax Big Box REIT for example). We show the entire calculation in full. You can track the result in your watchlist or portfolio and be alerted when this changes, or use our stock screener to discover 7 high quality undervalued stocks. If you save a screener we even alert you when new companies match - so you never miss a potential opportunity.
Next Steps
Mixed messages on Tritax Big Box REIT so far. If you want to move quickly and decide for yourself, start by weighing its 4 key rewards and 4 important warning signs.
Looking for more Tritax Big Box REIT style investment ideas?
Do not stop with Tritax Big Box REIT. Use the screener to quickly surface other opportunities so you are not relying on a single income play or valuation signal.
- Target quality at a discount by reviewing companies on our 7 high quality undervalued stocks that combine earnings strength with prices that sit below their assessed worth.
- Prioritise resilience by scanning the list of solid balance sheet and fundamentals (9 results) for businesses with cleaner debt profiles and sturdier financial foundations.
- Get ahead of the crowd by checking the 5 high quality undiscovered gems that pair solid fundamentals with lower market attention.
This article by Simply Wall St is general in nature. We provide commentary based on historical data and analyst forecasts only using an unbiased methodology and our articles are not intended to be financial advice. It does not constitute a recommendation to buy or sell any stock, and does not take account of your objectives, or your financial situation. We aim to bring you long-term focused analysis driven by fundamental data. Note that our analysis may not factor in the latest price-sensitive company announcements or qualitative material. Simply Wall St has no position in any stocks mentioned.
Have feedback on this article? Concerned about the content? Get in touch with us directly. Alternatively, email editorial-team@simplywallst.com