


Bossard Holding (SWX:BOSN), Why Is It Getting Attention Today?
Bossard Holding: Why Fresh 2026 Guidance Matters Now
Bossard Holding (SWX:BOSN) has put fresh numbers on the table for 2026, issuing new sales guidance and an EBIT margin target, while also reporting double digit third quarter and year to date sales growth.
That new 2026 guidance lands as Bossard Holding’s 1-month share price return of 13.79% and 90-day gain of 26.32% show building momentum, with a 69.23% year to date share price return and a 1-year total shareholder return of 58.86% contrasting with a 5-year total shareholder return that is still down 11.64%.
Scan how Bossard Holding’s fresh 2026 targets compare with other industrial and capital goods stocks that have strong financial profiles using our curated list of solid balance sheet and fundamentals (203 results).
Bossard Holding’s sharp re-rating and fresh 2026 targets point in the same direction: stronger business traction or just sentiment running hot ahead of reality. It is time to test what the current valuation actually implies.
Price-to-Earnings of 23.4x: Is Bossard Holding’s Premium Justified?
Valuation has already moved ahead of the latest guidance. At a last close of CHF264, Bossard Holding trades on a P/E of 23.4x, which points to a premium tag that investors need to weigh carefully.
The P/E ratio compares what you pay for each unit of earnings. For Bossard Holding, a 23.4x multiple means the market is willing to pay CHF23.40 for every CHF1 of current profit, which is a relatively full price for an industrial fastening and assembly specialist.
Annual earnings are forecast to grow 8.73%, earnings grew 28.4% over the past year, and the firm is expected to deliver a 22% Return on Equity in three years. Those figures suggest investors are paying up for a business with high quality earnings and a strong profitability profile, even though profit growth over the past five years has declined 7.1% per year.
The premium looks stretched when you line it up against peers. The European Trade Distributors industry average P/E sits at 16.9x, while a fair value P/E ratio for Bossard Holding is estimated at 20.7x. The current 23.4x level is higher than both, which signals the market is assigning a richer price than the regression based fair ratio level could move towards.
Explore the SWS fair ratio for Bossard Holding.
Result: Price-to-Earnings of 23.4x (OVERVALUED)
Still, Bossard Holding relies heavily on cyclical customer sectors, and any pullback in industrial demand or a shift in input costs could quickly challenge today’s rich multiple.
Find out about the key risks to this Bossard Holding narrative.
Another View on Bossard Holding’s Valuation
The P/E premium tells only part of the story. Our DCF model points to a fair value of CHF183.28 per share, while Bossard Holding changes hands at CHF267. The shares look materially overvalued on this lens, which raises a simple question: What has to go right to close that gap?
Look into how the SWS DCF model arrives at its fair value.
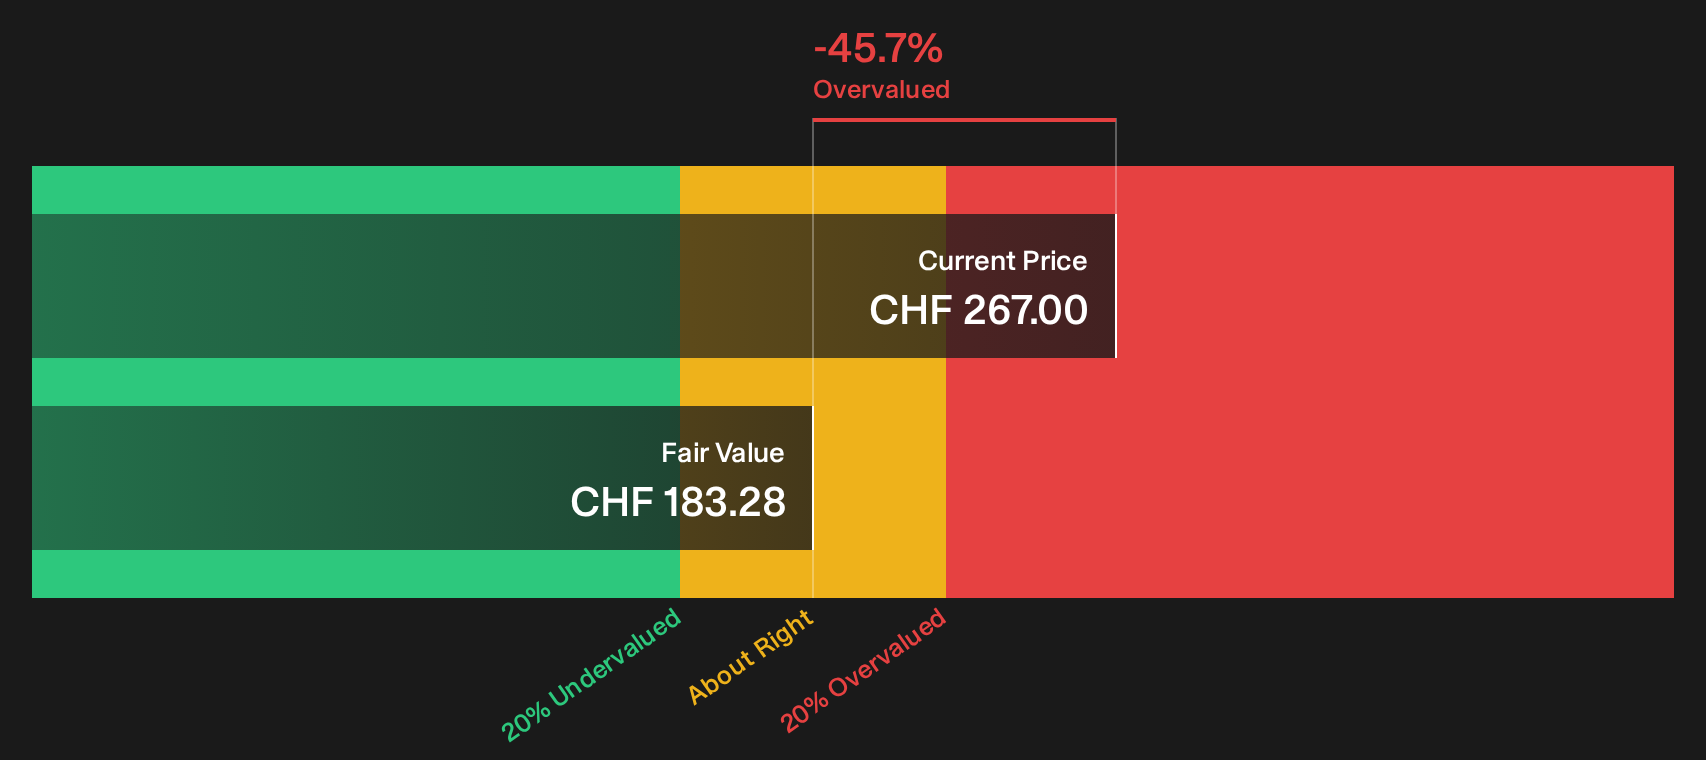
Simply Wall St performs a discounted cash flow (DCF) on every stock in the world every day (check out Bossard Holding for example). We show the entire calculation in full. You can track the result in your watchlist or portfolio and be alerted when this changes, or use our stock screener to discover 193 high quality undervalued stocks. If you save a screener we even alert you when new companies match - so you never miss a potential opportunity.
Next Steps
Plenty in this Bossard Holding story leans optimistic, yet the risk flags are real and cannot be ignored if you care about capital at stake. Take a moment to weigh both sides for yourself and then use the 2 key rewards and 1 important warning sign
Looking for more investment ideas beyond Bossard Holding?
If Bossard Holding feels fully priced, do not stop here. Broaden your watchlist with other ideas built from the same data driven process.
- Target steadier compounding potential by scanning a curated set of resilient companies through 231 resilient stocks with low risk scores built to hold up under tougher conditions.
- Hunt for mispriced quality by using the 193 high quality undervalued stocks and focus on businesses where fundamentals and current pricing appear out of sync.
- Spot early stage opportunities that the crowd has not crowded into yet with the 617 high quality undiscovered gems before attention catches up.
This article by Simply Wall St is general in nature. We provide commentary based on historical data and analyst forecasts only using an unbiased methodology and our articles are not intended to be financial advice. It does not constitute a recommendation to buy or sell any stock, and does not take account of your objectives, or your financial situation. We aim to bring you long-term focused analysis driven by fundamental data. Note that our analysis may not factor in the latest price-sensitive company announcements or qualitative material. Simply Wall St has no position in any stocks mentioned.
Have feedback on this article? Concerned about the content? Get in touch with us directly. Alternatively, email editorial-team@simplywallst.com