


SSY Group (SEHK:2005) Wins Two Drug Approvals, Is The Valuation Already Fair?
SSY Group (SEHK:2005) has secured Chinese regulatory approval for two type 3 chemical drugs, Nimodipine Oral Solution and Sodium Cromoglicate Eye Drops, expanding its presence in neurological, cardiovascular and ophthalmic treatments.
The approvals arrive as SSY Group’s shares trade at HK$2.75, with a 90-day share price return of 13.64% contrasting with a year-to-date share price decline of 3.85%. Meanwhile, the 1-year total shareholder return of 0.13% and 5-year total shareholder return decline of 15% point to modest long-term rewards and fading momentum over a multi-year horizon.
Scan how SSY Group stacks up against hand-picked peers by reviewing 195 high quality undervalued stocks that pair solid cash generation with stronger balance sheets.
SSY Group’s recent approvals and 90 day share price gain of 13.64% hint at fresh optimism. The key issue now is whether most of the upside is already in the price or still ahead, as investors reassess valuation.
Preferred Price-to-Earnings of 15.7x: Is it justified?
On simple valuation terms, SSY Group trades on a P/E of 15.7x, which is richer than several peers and suggests investors are paying up for each dollar of current earnings at the HK$2.75 share price.
The P/E ratio compares the share price with earnings per share and gives a quick read on how the market values current profitability. For a pharmaceutical group like SSY Group, where earnings can be influenced by product approvals, regulation and patent cycles, this measure often reflects how much confidence investors have in the durability of profits.
Here the market is attaching a higher earnings multiple than both direct peers and the wider Hong Kong pharmaceuticals group. SSY Group trades at 15.7x earnings, compared with a peer average of 10.7x and a Hong Kong pharmaceuticals industry average of 13.8x, which implies investors are accepting a premium price for forecast profit growth and the company’s earnings quality. The estimated fair P/E of 16.3x sits slightly above the current 15.7x, which suggests the present multiple is close to what the market could move toward if expectations hold.
Explore the SWS fair ratio for SSY Group.
Result: Price-to-Earnings of 15.7x (ABOUT RIGHT)
Still, the 3 year total shareholder return decline of 24.51% and 5 year decline of 14.99% suggest sentiment around SSY Group can weaken again if expectations slip.
Find out about the key risks to this SSY Group narrative.
Another view on SSY Group’s value
While the P/E suggests SSY Group trades close to its fair ratio at 15.7x versus a fair 16.3x, the SWS DCF model paints a much tighter picture. On that view, HK$2.75 broadly matches the estimated future cash flow value of HK$2.75, which leaves little obvious valuation gap either way and puts the focus back on execution.
For readers who want to see how this cash flow view is built line by line, Look into how the SWS DCF model arrives at its fair value.
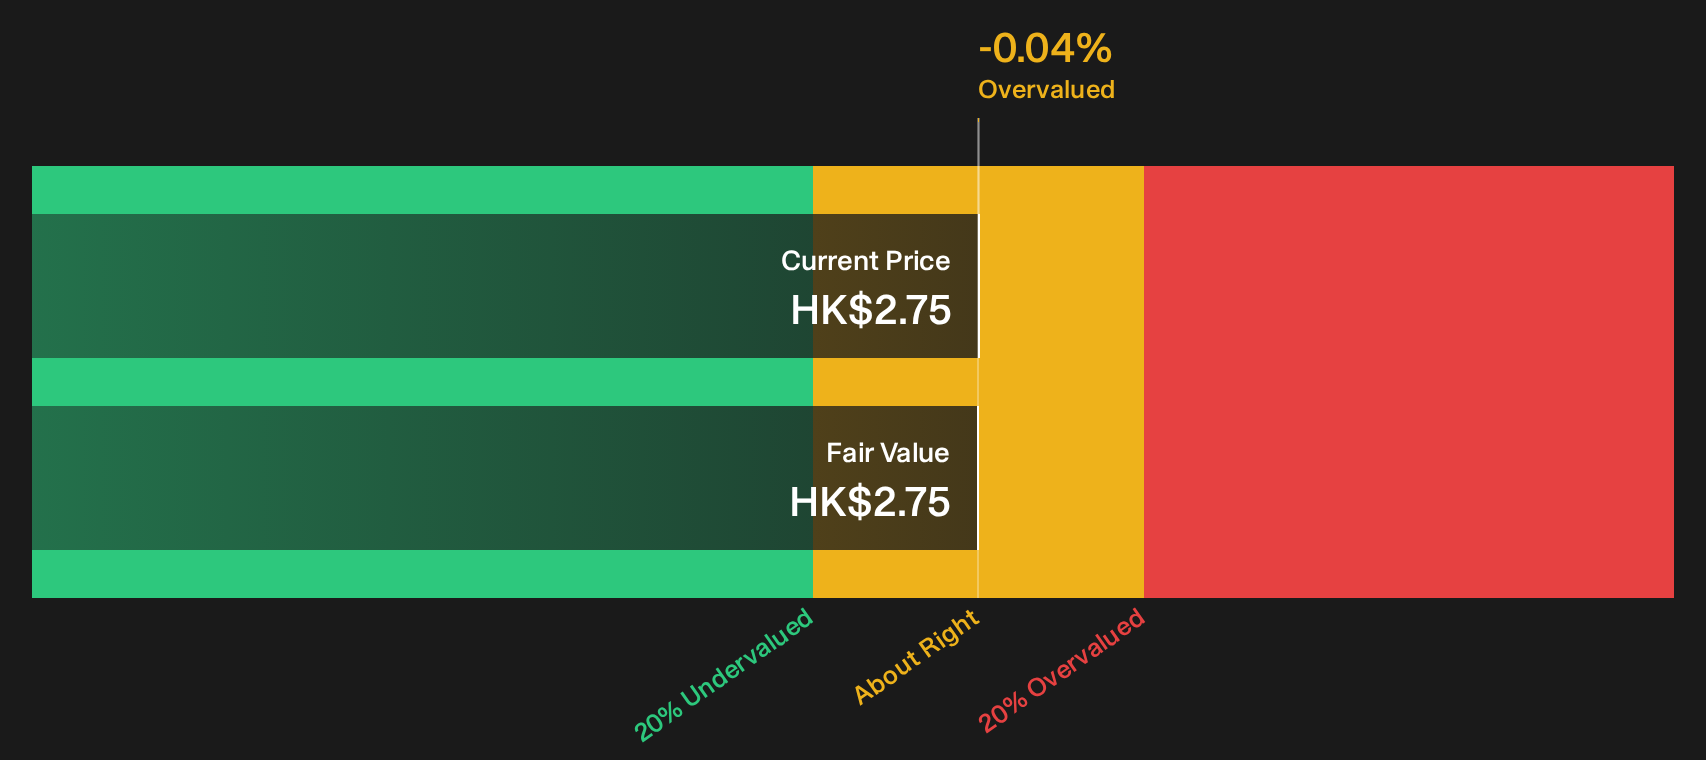
Simply Wall St performs a discounted cash flow (DCF) on every stock in the world every day (check out SSY Group for example). We show the entire calculation in full. You can track the result in your watchlist or portfolio and be alerted when this changes, or use our stock screener to discover 195 high quality undervalued stocks. If you save a screener we even alert you when new companies match - so you never miss a potential opportunity.
Next Steps
Given the mixed tone around SSY Group’s valuation and share price history, it helps to see the underlying drivers for yourself and move quickly to form a clear view. To see why some investors are still optimistic about its potential rewards, take a closer look at the 1 key reward
Looking for more investment ideas beyond SSY Group?
If SSY Group has sharpened your focus on opportunities, do not stop here. Fresh ideas often come from scanning the wider market with intent.
- Target potential income anchors by reviewing 217 dividend fortresses that aim to combine higher yields with resilience.
- Hunt for mispriced opportunities through the 195 high quality undervalued stocks that filter for strong cash generation at appealing valuations.
- Prioritise capital protection first by surveying the 227 resilient stocks with low risk scores that score well on resilience and downside control.
This article by Simply Wall St is general in nature. We provide commentary based on historical data and analyst forecasts only using an unbiased methodology and our articles are not intended to be financial advice. It does not constitute a recommendation to buy or sell any stock, and does not take account of your objectives, or your financial situation. We aim to bring you long-term focused analysis driven by fundamental data. Note that our analysis may not factor in the latest price-sensitive company announcements or qualitative material. Simply Wall St has no position in any stocks mentioned.
Have feedback on this article? Concerned about the content? Get in touch with us directly. Alternatively, email editorial-team@simplywallst.com