


Why Speculators May Want Another Crack at McDonald’s (MCD) a163% Options Payout
At least on a personal level, McDonald’s (MCD) has represented one of the more frustrating ideas in recent memory. In late September, I mentioned that the 240/245 bull call spread expiring Oct. 16 appeared to be an intriguing contrarian idea. Basically, the theory was that the then-extremely bearish state of MCD stock would likely transition to a bullish state (based on an inductive analysis of past analogs).
In principle, the trajectory of McDonald’s stock ultimately moved in the appropriate direction. Unfortunately, the swing higher came a bit too late. Yes, in the trailing five sessions, MCD did move up 3.34%, aiding my cause. But at a closing price of $242.50 on Thursday (Oct. 15), the bull spread only exceeded the breakeven price at the time of execution of $242.29.
At this juncture, I don’t necessarily consider the idea a loss but it’s also not a win. Still, I’d like another bite at the apple, with the latest speculation targeting McDonald’s third-quarter earnings report, scheduled for a Nov. 4 release. If we were to interpret the latest technical fluctuations, there might be an argument that much of the bad news has been baked in. If so, upside resistance could be muted, allowing MCD stock to flourish.
Granted, the volatility skew for the upcoming November monthly chain seems rather balanced, perhaps indicative of a wait-and-see approach. At the same time, with pessimism having been a dominant theme in the broader consumer market, even a little bit of good news could have a disproportionate impact.
Ultimately, for McDonald’s stock, the combination of unexpected good news plus the historical tendency of transition from a bearish state to a bullish one likely puts the $255 price target into play for the November monthly chain.
Plotting a Mathematically Incentivized Options Trade for MCD Stock
Looking at the strike selections for derivatives expiring Nov. 20, the lowest strike price within a bull spread pairing that still offers a positively asymmetric payout is the $250 strike; specifically, I’m referring to the 245/250 bull spread. Here, the speculator pays a net debit of $240 in the hopes of seeing McDonald’s stock trigger the $250 strike on expiration. If it does, the maximum profit would be $260, a payout of over 108%.
That might seem more palatable to conservative speculators compared to other, higher-leg spreads. Right now, the 245/250 spread features a probability of profit (breakeven) of 39.6% and a full-profit probability of 34.58% (using Wall Street’s implied probability distribution curve, which you can find across several options-related resources).
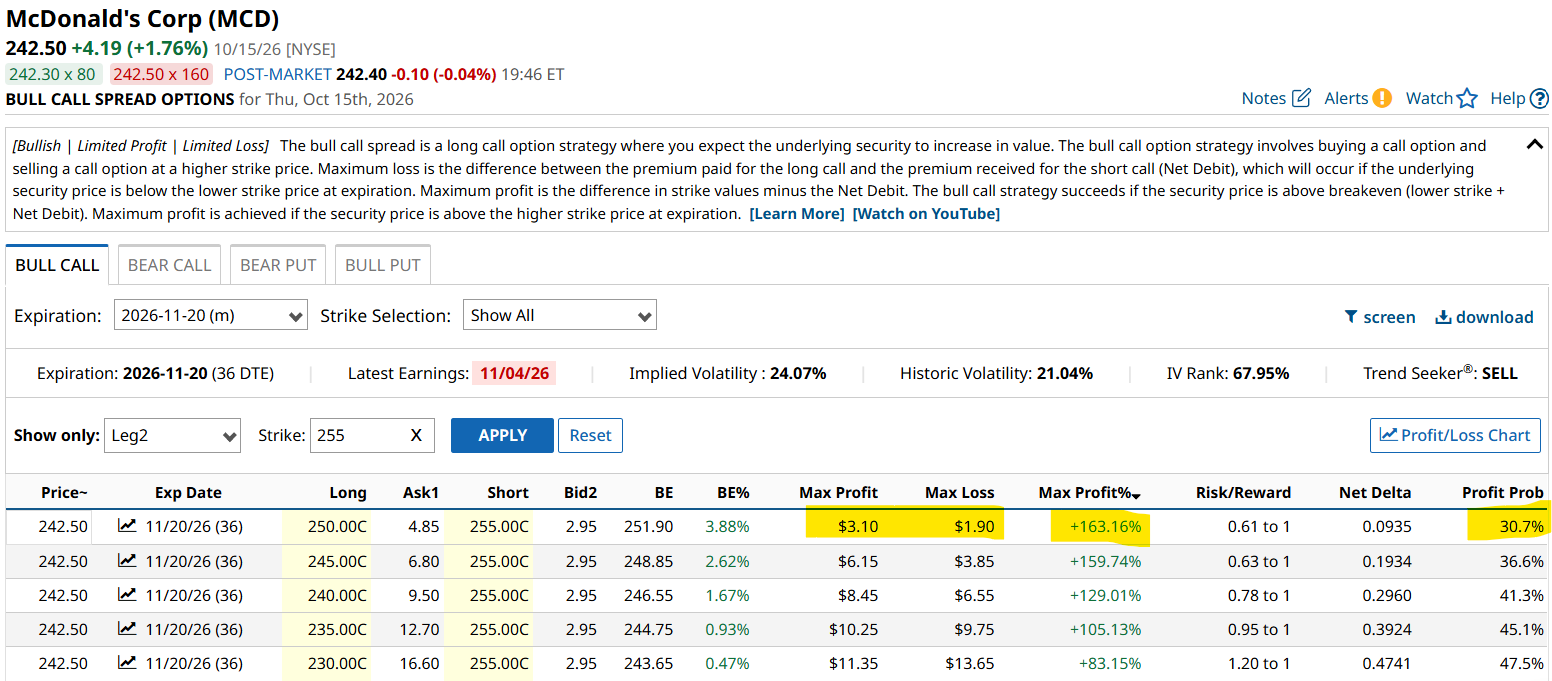
But what about the next strike higher? The trade that I’m most interested in is the 250/255 bull spread, also expiring Nov. 20. Here, the net debit lowers to $190 but the maximum profit rises to $310, resulting in a payout of over 163%.
While that’s a much better reward, here’s the drawback: breakeven probability on expiration is only 30.7% (as MCD stock would obviously have to rise to a higher threshold) while full-profit probability slips to 25.49%.
When inputting the above parameters into an expected value (EV) calculator, both trades would yield negative expectancy. However, the more aggressive trade — the 250/255 spread — would have an EV of $62.55 below parity, whereas the more conservative of the two would incur an EV of $67.10 below zero.
Subsequently, there may be an argument of targeting the more aggressive wager for McDonald’s stock. What would really separate the two ideas is if the $255 spread would either see its payout or its probability improve. Only one of these can be modulated.
Shifting the Goalposts in Our Favor
Wall Street isn’t in the business of handing out gifts to retail traders. As such, you shouldn’t expect an increase in payout without accepting a proportional rise in risk. With that concept a non-starter, we can then focus our attention on the probability of success — that metric can be changed (and I would argue should be changed when circumstances warrant it).
While the idea may sound like the shifting of goalposts, a probabilistic methodology must involve some initial assumption or framework to advance the argument in question. In other words, while the mathematical architecture of probabilistic models is universal and objective, the application of probabilities is at least partially philosophical.
And what philosophy does the Street use in its implied probability models? It uses the random walk, which boils down to the fact that if indeed MCD stock undergoes such random behavior between now and the expiration date, then the previously cited probabilities are wholly relevant — they would simply represent the mathematics of randomness.
But the meta question is this: how confident are you that McDonald’s stock will trade randomly?
Estimating the Nonrandom Walk for McDonald’s Stock
Of course, it’s well within the realm of possibility that MCD stock could go on a random walk to the November expiration. I just believe it’s unlikely based on the historical data. Within the last 10 weekly candlesticks that MCD printed in the technical chart, only three of the sessions resulted in net positive price action.
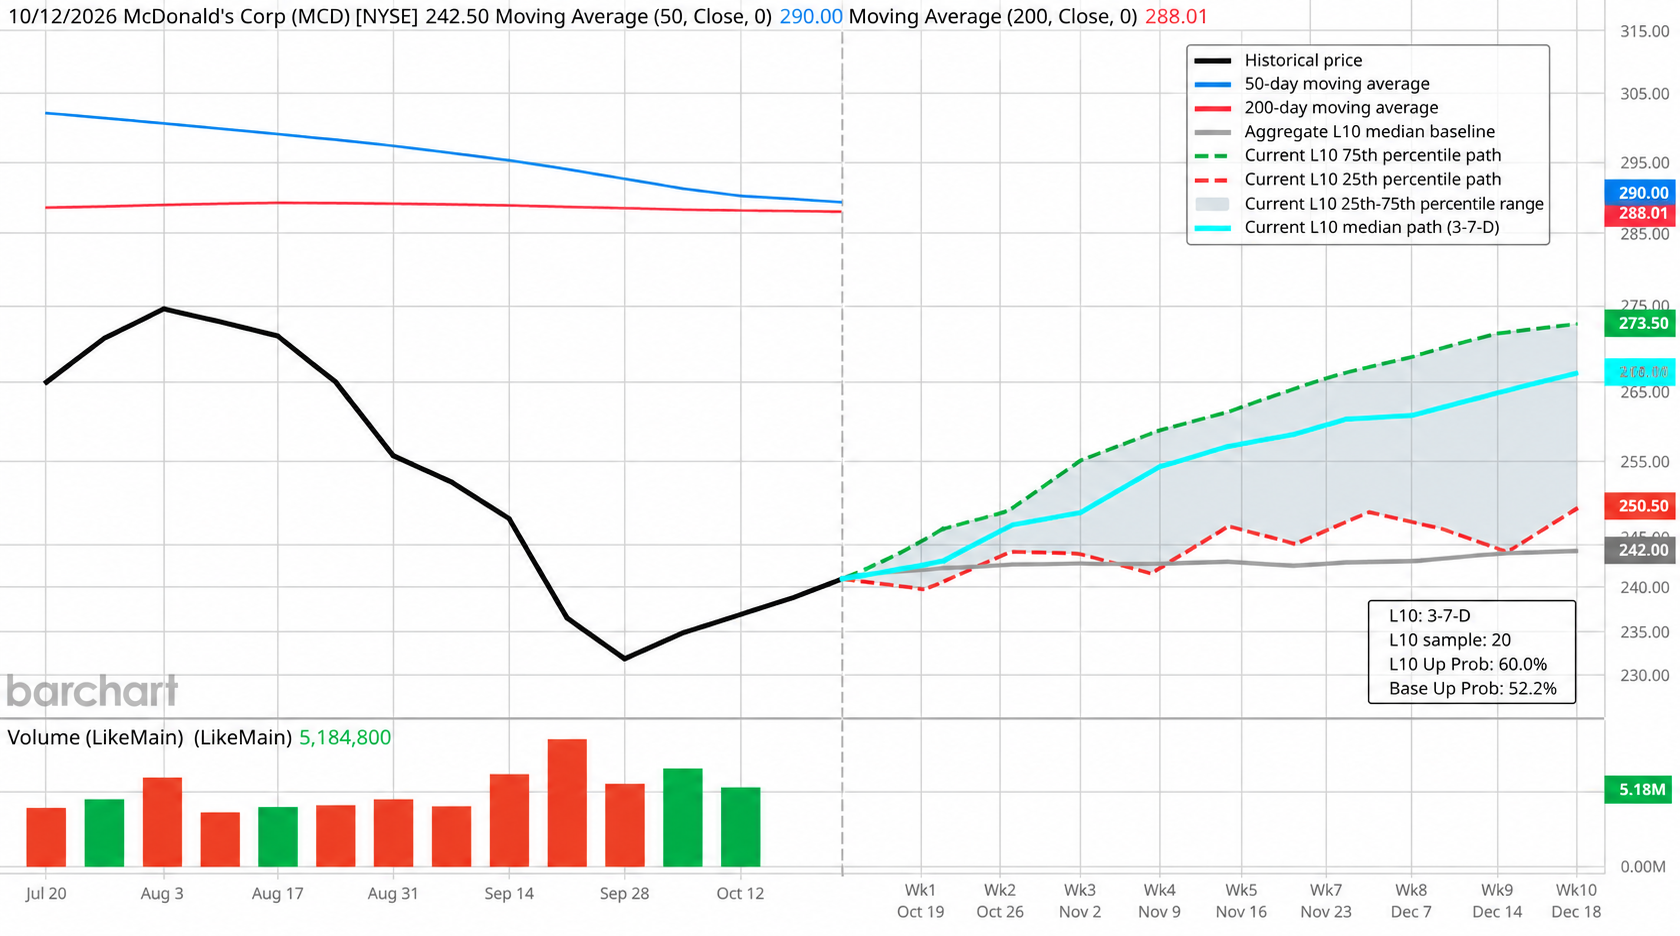
Such a bearish sequence is rare for McDonald’s stock, having only materialized 20 times on a rolling basis over the approximately last five trailing years. But what’s interesting is that over the next 10 weeks, MCD generally tends to respond positively, enough so that the probability of the ticker hitting the equivalent of the $255 strike on Nov. 20 may range between 40% and 65%.
If we were to simply split the difference at 52.5%, the aforementioned $255 spread would have an EV of +$72.50. Even at the lower 40% metric, the EV would be +$10.
To be crystal clear, there is no guarantee that a positive transition will occur from a bearish state to a bullish one. Also, an earnings miss could easily crumble the above assessment, irrespective of established historical patterns. And as my earlier October spread idea demonstrated, sometimes, the right idea may not move fast enough.
Still, in order to see big gains, accepting big risks is an inherent part of the game. In my opinion, the focus should be on calculating risk in a rational manner — and McDonald’s stock just might be a prime candidate.
On the date of publication, Josh Enomoto did not have (either directly or indirectly) positions in any of the securities mentioned in this article. All information and data in this article is solely for informational purposes. For more information please view the Barchart Disclosure Policy here.