


How Investors May Respond To J&J (JNJ) Raised 2026 Guidance
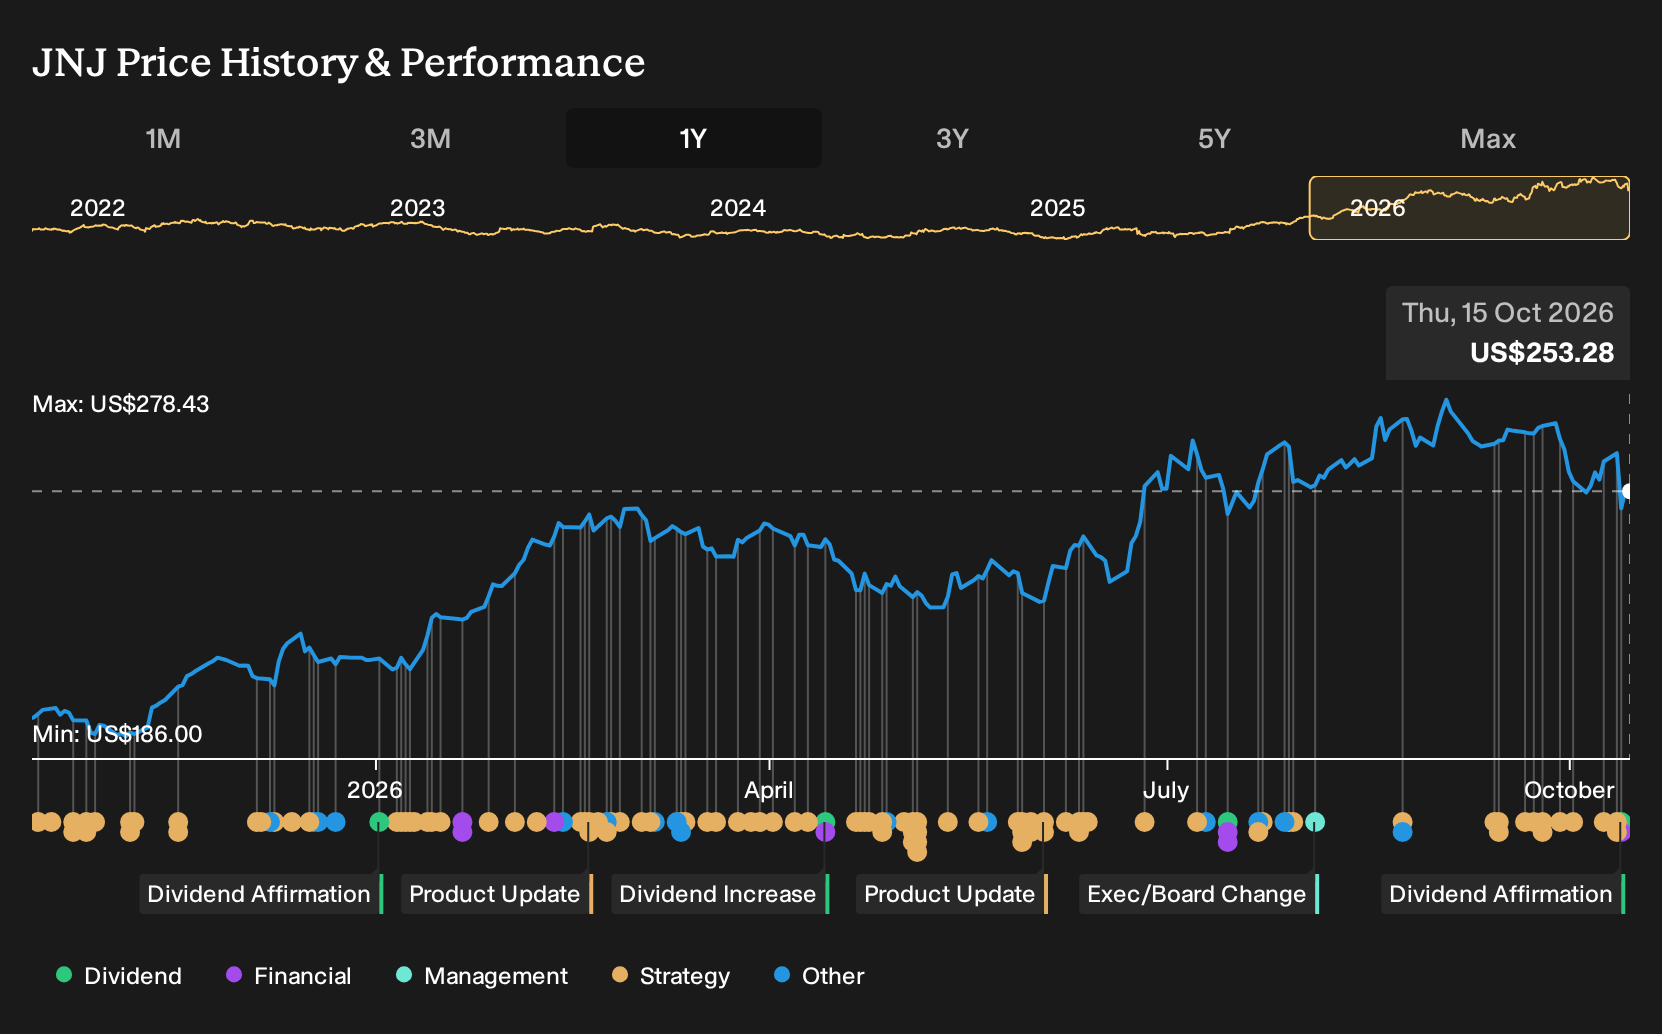
- Johnson & Johnson raised its full year 2026 guidance after reporting higher sales from its Innovative Medicine segment, backed by TREMFYA long term Crohn's disease data, early ICOTYDE uptake and a reaffirmed fourth quarter dividend of US$1.34 per share declared for payment in December 2026.
- The mix of rising pharmaceutical contributions and softer MedTech activity highlights how Johnson & Johnson's earnings profile currently leans on immunology assets, while device execution and pricing pressure remain key operational watchpoints.
- Next, the focus turns to how Johnson & Johnson's lifted 2026 outlook, anchored in TREMFYA strength, reshapes the broader investment narrative.
Scan how other large healthcare and pharma players are pricing growth, risk, and dividends right now with a curated set of list of solid balance sheet and fundamentals (25 results)
Johnson & Johnson Investment Narrative Recap
To stay invested in Johnson & Johnson, you need to be comfortable with a story where Innovative Medicine, led by assets like TREMFYA and ICOTYDE, carries more of the load, while MedTech works through slower execution and pricing pressure. The raised 2026 outlook and affirmed dividend point to a business leaning on high value therapies while it tunes weaker franchises.
The key near term swing factor remains clean delivery on new drug launches and oncology expansion, especially as one off items and softer device trends cloud earnings quality. The biggest operational risk is that MedTech underperformance, tariffs or litigation costs offset progress in immunology and neuroscience before newer products fully scale.
Among the recent updates, the three year TREMFYA Crohn's disease data looks most relevant to the current guidance bump. Management is effectively leaning on that drug's long duration efficacy and safety profile to support higher Innovative Medicine expectations and to offset the drag from STELARA loss of exclusivity and softer MedTech activity.
For you as a shareholder, the TREMFYA dataset matters because it underpins confidence in long running prescriptions in a chronic disease where treatment persistence is critical. Execution risk sits in converting strong clinical results into sustained global uptake while managing pricing, competition from other biologics and any future reimbursement or regulatory shifts.
Johnson & Johnson Consensus Expectations Check
Analysts currently map out a Johnson & Johnson scenario where annual revenue growth of 7.2% feeds into higher profitability over the next few years. Profit margins are modeled to move from 21.5% today to 23.7% in three years as higher value drugs take a larger share of the mix.
On earnings, the group forecast points to profit of US$28.6b by 2029, compared with US$21.0b today, with the more cautious end of the range at US$22.9b. That implies an earnings increase of about US$7.6b from the current level to the 2029 consensus figure if the central estimate plays out.
Those profit expectations sit alongside a projected revenue line of US$120.5b in 2029, which is the anchor used in the current fair value work. To line up with that view, investors would need to be comfortable with Johnson & Johnson trading on a P/E of 28.1x in 2029, slightly below the present multiple of 29.3x but above the 15.5x level flagged for the wider US pharmaceuticals peer group.
Johnson & Johnson's narrative projects revenues of US$120.5b and earnings of US$28.6b by 2029. This setup assumes 7.2% yearly revenue growth and an earnings increase of about US$7.6b from US$21.0b today.
The analyst price targets cluster around US$270.59 per share, with the current quote of US$255.82 sitting only 5.5% below that mark based on the latest snapshot. The spread from US$190.00 at the bearish end to US$305.00 at the optimistic end shows there is still real disagreement on how much weight to give to drug exclusivity risk, MedTech execution, and litigation exposure.
For an individual investor, the key question is whether those revenue and earnings forecasts look reasonable given personal views on TREMFYA uptake, STELARA erosion, MedTech pricing pressure, tariffs and settlement outcomes. The closer personal assumptions sit to the consensus path, the more that current pricing and targets are likely to feel in the right ballpark rather than stretched in either direction.
Uncover why Johnson & Johnson's fair value indicates a 7% potential upside to its current price that may not last much longer.
Exploring Other Perspectives
One alternate storyline for Johnson & Johnson puts MedTech robotics risk front and center. In that view, OTTAVA and related platforms might scale slowly, which could justify those lower price targets around US$219.83 even while bearish analysts were still penciling in about US$120.1b of 2029 revenue and US$28.9b of earnings before this guidance hike and dividend affirmation.
Explore 9 other Johnson & Johnson fair value estimates, including one that suggests as much as 9% downside from the current price.
Decide For Yourself
Disagree with existing narratives? Extraordinary investment returns rarely come from following the herd, so trust your own research and judgment.
- A great starting point for your Johnson & Johnson research is our analysis highlighting 3 key rewards and 3 important warning signs that could impact your investment decision.
- See our latest analysis for Johnson & Johnson. The report includes a comprehensive fundamental analysis summarized in a single visual, the Snowflake, making it easy to evaluate Johnson & Johnson's overall financial health at a glance.
Looking For More Investment Ideas Beyond Johnson & Johnson?
If Johnson & Johnson helps you frame the kind of quality and resilience you want in a portfolio, the next step is to widen the search using broader stock lists that match specific goals such as value, income, or balance sheet strength.
- If you want potential bargains with stronger fundamentals than their price suggests, start with a focused group of 33 high quality undervalued stocks that already clear basic quality and valuation checks.
- If reliable income is a priority, filter for companies that combine higher yields with more resilient cash flows by scanning a curated set of 8 dividend fortresses.
- If capital preservation matters most, concentrate on businesses with sturdier finances and lower overall risk scores by working through a targeted 32 resilient stocks with low risk scores.
This article by Simply Wall St is general in nature. We provide commentary based on historical data and analyst forecasts only using an unbiased methodology and our articles are not intended to be financial advice. It does not constitute a recommendation to buy or sell any stock, and does not take account of your objectives, or your financial situation. We aim to bring you long-term focused analysis driven by fundamental data. Note that our analysis may not factor in the latest price-sensitive company announcements or qualitative material. Simply Wall St has no position in any stocks mentioned.
Have feedback on this article? Concerned about the content? Get in touch with us directly. Alternatively, email editorial-team@simplywallst.com