


Why Did AMN Healthcare Services (AMN) Move Today?
AMN Healthcare Services (AMN) has attracted fresh attention after a strong year-to-date share price move. The stock closed at US$40.00 and posted double digit gains over the past month.
Recent trading has been brisk, with a 6.21% 1 day share price return contributing to a 12.87% 7 day and 17.13% 30 day share price return, while AMN Healthcare Services still shows a 3 year total shareholder return that is down 45.46%.
Scan how AMN Healthcare Services compares with other potential turnaround opportunities by checking our curated list of 20 high quality undiscovered gems across the market.
Bulls see a beaten down healthcare recruiter snapping back after a sharp move, while bears point to falling annual revenue and net income. Which side does AMN Healthcare Services' current valuation actually support next?
Most Popular Narrative: 11% Overvalued
On the most followed view, AMN Healthcare Services carries a fair value of about $36.14 compared with the recent $40.00 close. This frames the latest rally against relatively cautious long term assumptions.
The current valuation implies that AMN Healthcare Services is fairly valued and that the market is already pricing in both the benefits of structural demand for flexible staffing and the earnings risk from margin pressure and mixed segment trends, so the share price does not look priced for a strong upside surprise.
See why 0 investors see AMN Healthcare Services as 11% overvalued.
Result: Fair Value of $36.14 (OVERVALUED)
Still, AMN Healthcare Services faces real pressure if hospitals lean harder into permanent hiring and if pricing weakness in language services persists longer than analysts currently assume.
Find out about the key risks to this AMN Healthcare Services narrative.
Another Take On AMN Healthcare Services' Valuation
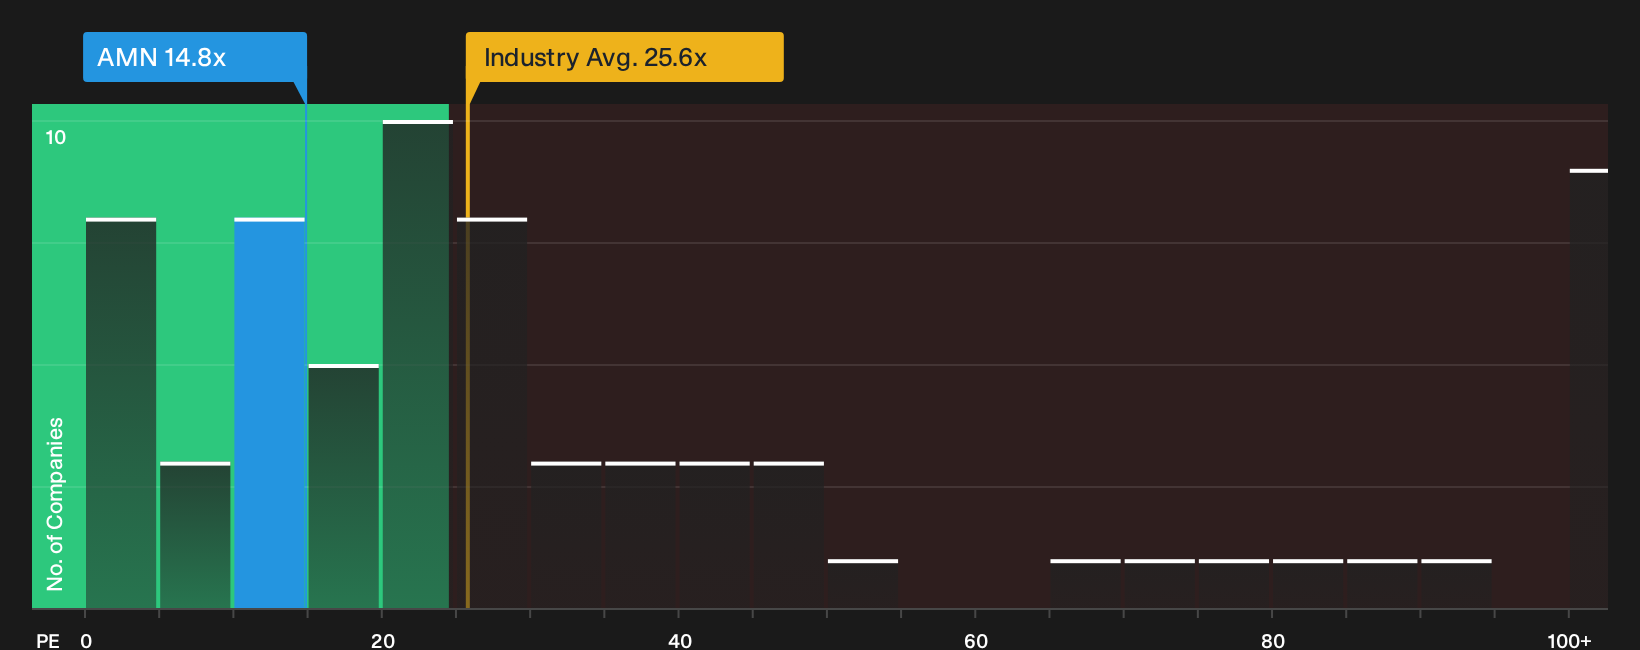
On simple earnings multiples, AMN Healthcare Services looks mixed. The stock trades on a P/E of 14.8x, which is cheaper than both the US Healthcare industry on 24.5x and peers on 22.1x. Yet the fair ratio sits at just 3.2x, which hints that if earnings play out as currently modeled, the market could decide it is already paying up. Does that gap flag upside being limited, or does it just reflect very low expectations baked into the earnings outlook?
Before leaning on that single number, it helps to see exactly how the current price compares to peers and the fair ratio in detail, then judge whether the earnings profile justifies any premium or discount in your own view. See what the numbers say about this price — find out in our valuation breakdown.
Next Steps
Sentiment looks split on AMN Healthcare Services, so act promptly, review the underlying figures, and weigh both the 2 key rewards and 3 important warning signs.
Looking for more investment ideas beyond AMN Healthcare Services?
Do not stop with AMN Healthcare Services. Put the recent move in context by lining it up against other opportunities through a few focused stock screeners that surface very different types of ideas.
- Target reliable income streams by reviewing companies that show up in our 8 dividend fortresses and see which payouts might fit your cash flow goals.
- Hunt for mispriced opportunities by running through the 33 high quality undervalued stocks and compare where the market price sits against underlying business strength.
- Reduce nasty surprises in your portfolio by checking the 32 resilient stocks with low risk scores and focusing on businesses with sturdier financial and risk profiles.
This article by Simply Wall St is general in nature. We provide commentary based on historical data and analyst forecasts only using an unbiased methodology and our articles are not intended to be financial advice. It does not constitute a recommendation to buy or sell any stock, and does not take account of your objectives, or your financial situation. We aim to bring you long-term focused analysis driven by fundamental data. Note that our analysis may not factor in the latest price-sensitive company announcements or qualitative material. Simply Wall St has no position in any stocks mentioned.
Have feedback on this article? Concerned about the content? Get in touch with us directly. Alternatively, email editorial-team@simplywallst.com