


Is Westamerica Bancorporation (WABC) Undervalued As Third Quarter Earnings Hold Steady?
Westamerica Bancorporation (WABC) just posted third quarter 2026 results, reporting net income of US$28.15 million and basic earnings per share of US$1.22. These core figures provide the latest read on this regional bank.
The earnings release has landed alongside a strong share price run, with Westamerica Bancorporation’s stock at US$60.90 and a year to date share price return of 27.33%, while the 1 year total shareholder return of 37.78% points to solid long term momentum.
See how Westamerica Bancorporation compares with other regional banks by reviewing a curated set of list of solid balance sheet and fundamentals (25 results) aligned with similar earnings profiles.
That kind of double digit share price gain alongside largely steady earnings invites a closer look. Is Westamerica Bancorporation’s recent climb rooted in fundamentals, or has sentiment simply reset where the stock trades?
Preferred P/E of 12.7x: Is it justified?
On valuation, Westamerica Bancorporation is being judged through a simple lens. The stock trades on a P/E of 12.7x at a last close of $60.90, which leaves it marked as expensive versus the broader US banks industry but cheaper than its closer peer group.
The P/E ratio compares the current share price with earnings per share. For a regional lender like Westamerica Bancorporation, this metric effectively reflects what investors are willing to pay today for each dollar of current profit, in a sector where earnings are heavily tied to interest margins, credit quality, and fee income.
Here the picture is mixed. The shares are described as expensive compared to the US banks industry average P/E of 11.3x, which suggests the market is putting a premium on this earnings stream relative to the wider sector. At the same time, the stock is described as good value relative to a peer average P/E of 16.6x, which implies investors are not paying as high a multiple as they are for more closely comparable banks with similar profiles.
That split is important. A higher P/E than the sector points to expectations embedded in the price. However, a lower P/E than direct peers suggests that on a like for like basis, the market is assigning a more modest tag than it does to similar firms. With no fair ratio available, there is no additional anchor level that the multiple could converge toward, so any judgment rests on how readers weigh sector versus peer comparisons.
See what the numbers say about this price — find out in our valuation breakdown.
Result: Price-to-earnings of 12.7x (ABOUT RIGHT)
Still, if credit quality weakens or deposit costs rise faster than expected, the current P/E case for Westamerica Bancorporation could come under pressure.
Find out about the key risks to this Westamerica Bancorporation narrative.
Another View: What The DCF Model Says About Westamerica Bancorporation
The share price sits at $60.90, yet our DCF model pegs Westamerica Bancorporation’s future cash flow value at $113.69. That gap of roughly 46% below this estimate frames the stock as undervalued on this method, even though the current P/E already looks reasonable.
Two stories now sit side by side. One paints WABC as slightly expensive against the wider banks industry on earnings, while the SWS DCF model suggests the market is giving limited credit to its long term cash generation. Which lens do you trust more when real money is on the line?
Look into how the SWS DCF model arrives at its fair value.
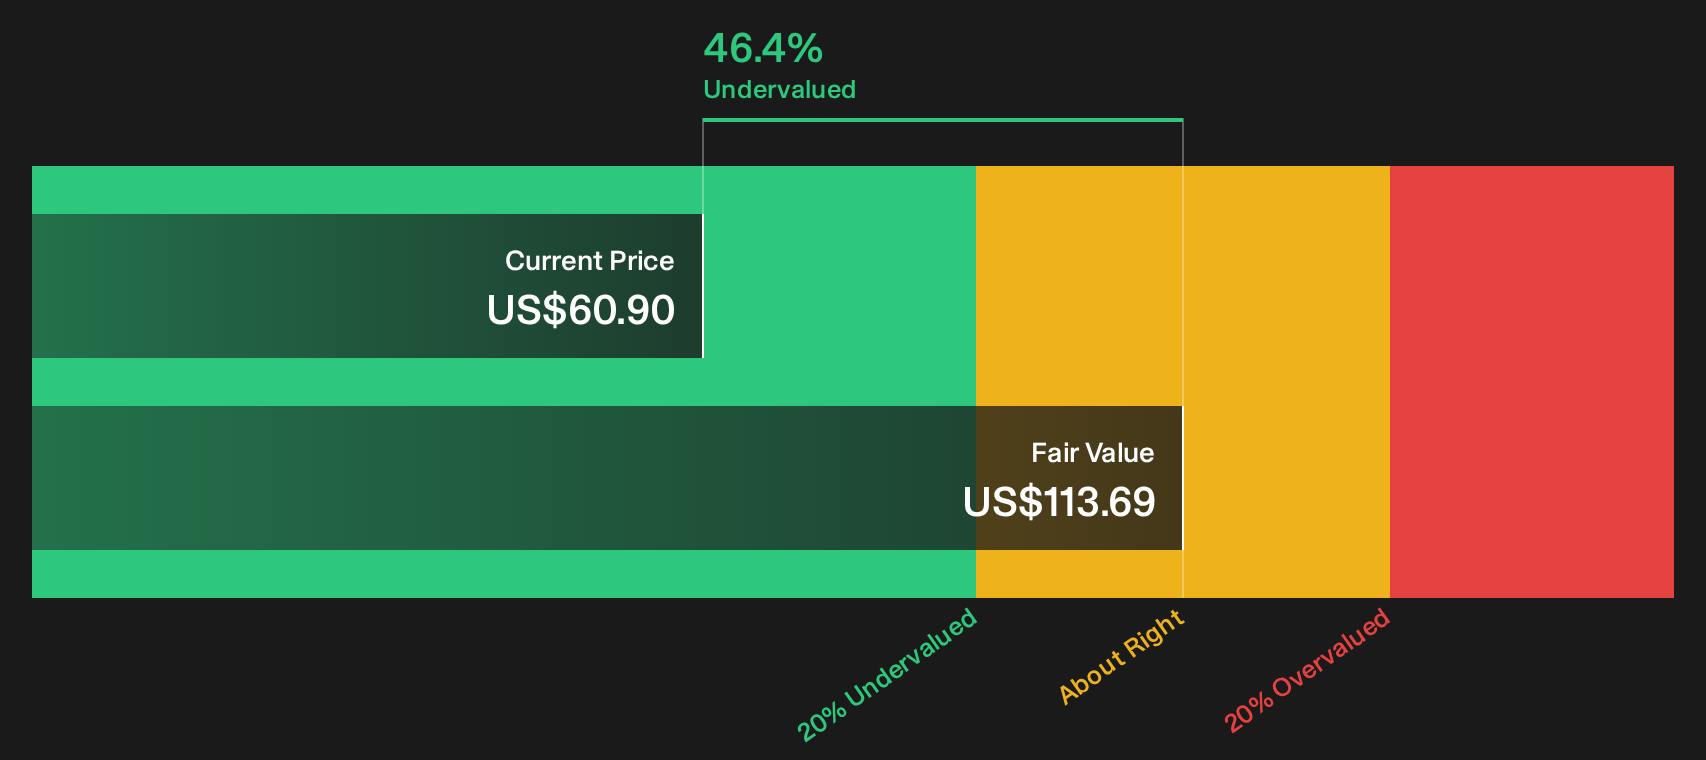
Simply Wall St performs a discounted cash flow (DCF) on every stock in the world every day (check out Westamerica Bancorporation for example). We show the entire calculation in full. You can track the result in your watchlist or portfolio and be alerted when this changes, or use our stock screener to discover 33 high quality undervalued stocks. If you save a screener we even alert you when new companies match - so you never miss a potential opportunity.
Next Steps
Feeling torn between the P/E story and the DCF view on Westamerica Bancorporation is normal. Move quickly from reading to checking the numbers yourself, then weigh those figures against the 2 key rewards
Looking for more investment ideas beyond Westamerica Bancorporation?
If Westamerica Bancorporation has sharpened your focus on valuation and quality, you can use that momentum to broaden your watchlist and test your next moves.
- Target resilient balance sheets by scanning companies with strong fundamentals and low financial strain through the list of solid balance sheet and fundamentals (25 results).
- Look for potential mispricing by reviewing the 33 high quality undervalued stocks that combine quality metrics with more modest valuations.
- Build a watchlist of income ideas by filtering for the 8 dividend fortresses that may help anchor portfolio returns with sizable payouts.
This article by Simply Wall St is general in nature. We provide commentary based on historical data and analyst forecasts only using an unbiased methodology and our articles are not intended to be financial advice. It does not constitute a recommendation to buy or sell any stock, and does not take account of your objectives, or your financial situation. We aim to bring you long-term focused analysis driven by fundamental data. Note that our analysis may not factor in the latest price-sensitive company announcements or qualitative material. Simply Wall St has no position in any stocks mentioned.
Have feedback on this article? Concerned about the content? Get in touch with us directly. Alternatively, email editorial-team@simplywallst.com