


Silvercorp Metals (TSX:SVM) Aligns With Hong Kong Rules, Is The Premium Already Too High?
Corporate governance shift at Silvercorp Metals
Silvercorp Metals (TSX:SVM) shareholders approved amendments to the company’s Articles on October 2, 2026, aligning its governing documents with listing rules of The Stock Exchange of Hong Kong.
Investors have seen mixed momentum in Silvercorp Metals recently, with the share price down 12.56% over the past 30 days but up 10.70% over 90 days and 21.05% year to date. Total shareholder return of 32.36% over one year and very large gains over three and five years point to strong longer term compounding as the governance shift toward Hong Kong listing standards reshapes how the market weighs both opportunity and risk around the stock.
Scan beyond Silvercorp Metals and see how other producers with similar governance or listing shifts line up in our curated list of 10 top silver producer stocks.
Silvercorp Metals now has a fresh governance framework and a share price that has recently pulled back. Do you lean into this reset, or hold out for an even cheaper entry before running the numbers?
Price-to-earnings of 69x: Is it justified for Silvercorp Metals?
At CA$13.86, Silvercorp Metals trades on a P/E of 69x, which points to a rich earnings tag compared with both its own history and sector peers.
The P/E ratio compares the current share price to earnings per share and is often used as a quick check on how much investors are paying for each dollar of profit. For a metals producer like Silvercorp Metals, that multiple can reflect views on future production, commodity exposure, and how durable profits might be through the cycle.
Analyst expectations point to revenue growth of 29.2% per year and earnings growth of 43.2% per year, which goes some way to explaining why the P/E sits high. Even with that, the current 69x earnings multiple is described as expensive compared with the Canadian Metals and Mining industry average of 14.7x and a fair P/E estimate of 27.7x. This suggests a level the market could move toward if sentiment cools.
Explore the SWS fair ratio for Silvercorp Metals.
Result: Price-to-earnings of 69x (OVERVALUED).
Still, the Silvercorp Metals story can quickly change if Chinese operating conditions tighten or if investor appetite for high P/E miners cools sharply.
Find out about the key risks to this Silvercorp Metals narrative.
Another view on Silvercorp Metals’ value
The earnings multiple paints Silvercorp Metals as expensive, yet the SWS DCF model points the other way. On that view, the shares at CA$13.86 trade below an estimated future cash flow value of CA$44.40, which frames the current quote as a discount rather than a premium.
That is a wide gap for any investor to weigh. Does this signal mispricing that could close over time, or does it highlight how fragile any cash flow forecast can be in a cyclical miner?
Look into how the SWS DCF model arrives at its fair value.
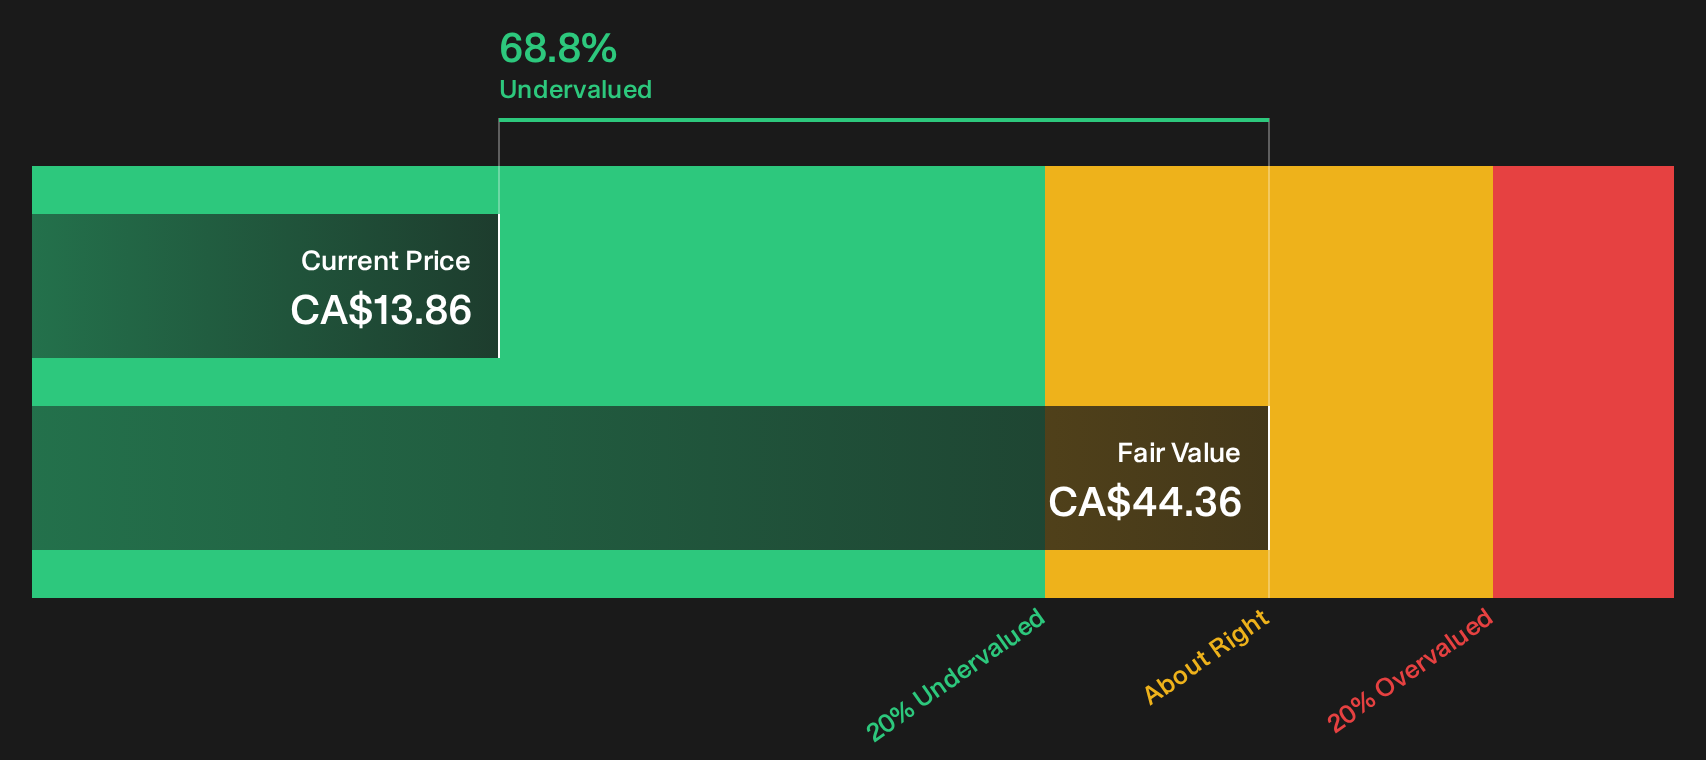
Simply Wall St performs a discounted cash flow (DCF) on every stock in the world every day (check out Silvercorp Metals for example). We show the entire calculation in full. You can track the result in your watchlist or portfolio and be alerted when this changes, or use our stock screener to discover 6 high quality undervalued stocks. If you save a screener we even alert you when new companies match - so you never miss a potential opportunity.
Next Steps
Mixed signals on valuation and governance at Silvercorp Metals will mean different things to different investors, so review the underlying data promptly and decide where you stand with the 3 key rewards and 3 important warning signs.
Looking for more Silvercorp Metals investment ideas?
If Silvercorp Metals has you rethinking where to put fresh capital, now is the moment to scan a wider field of potential opportunities before they move.
- Spot potential bargains early by checking companies on our 10 high quality undiscovered gems that combine strong fundamentals with less crowd attention.
- Prioritise resilience by reviewing businesses in the 8 resilient stocks with low risk scores that pair sturdier balance sheets with lower overall risk scores.
- Target quality and value together by using the list of solid balance sheet and fundamentals (8 results) to surface ideas backed by healthier financial foundations.
This article by Simply Wall St is general in nature. We provide commentary based on historical data and analyst forecasts only using an unbiased methodology and our articles are not intended to be financial advice. It does not constitute a recommendation to buy or sell any stock, and does not take account of your objectives, or your financial situation. We aim to bring you long-term focused analysis driven by fundamental data. Note that our analysis may not factor in the latest price-sensitive company announcements or qualitative material. Simply Wall St has no position in any stocks mentioned.
Have feedback on this article? Concerned about the content? Get in touch with us directly. Alternatively, email editorial-team@simplywallst.com