


Walsh Pure Grain Technicals / Daily News – Pure Hedge Division
Walsh Pure Grain Technicals / Daily News – Pure Hedge Division
Tim Healy 10/15/2026
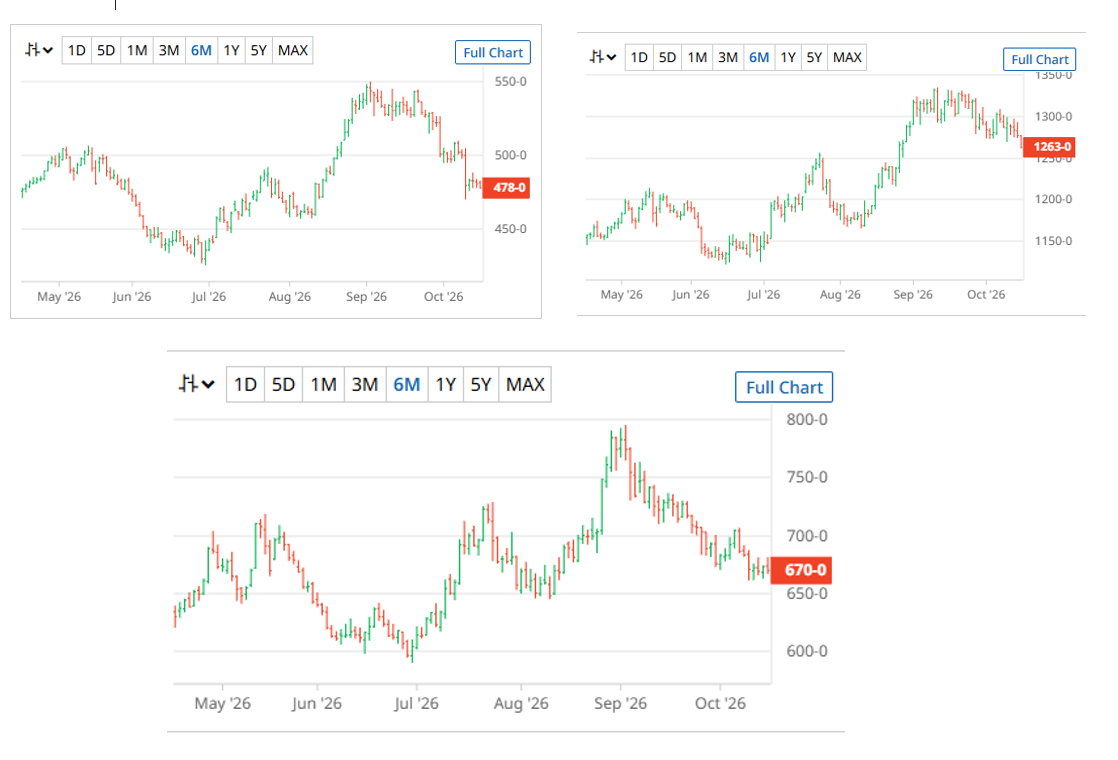
Dec’26 Corn
Sharp selloff: October 9 closed down 20.50¢, or 4.10%.
Lower prices: Corn fell from 483¢ on October 12 to 478¢ on October 15.
Moving-average direction: All three averages are declining. The 7-day average is falling faster than the 21-day average.
Support to watch: 476¢, followed by the October 9 low of 470.25¢.
Resistance to watch: 483–488¢, then the 7-day MA at 486.64¢.
Signal: Sellers remain in control. A move back above 486–488¢ would be an initial improvement, but not yet a confirmed reversal.
Price < 7-day MA
7-day MA < 14-day MA
14-day MA < 21-day MA
This is a textbook bearish alignment.
What stands out
The 7-day MA sits over 10¢ below the 14-day average.
The 14-day sits almost 12¢ below the 21-day average.
Implication
Trend-following signals remain bearish.
Rallies toward 487-497 (7- and 14-day averages) likely become resistance zones.
Bulls need a close back above the 7-day average before discussing a trend reversal.
Nov ’26 Soybeans (Weak but Better Than Corn)
Trend Structure
Price < 7-day MA
7-day MA is only slightly below the 14-day MA
14-day MA < 21-day MA
What stands out
The 7-day and 14-day averages are only about 2½ cents apart.
The trend is still bearish, but less aggressively than corn.
Implication
Soybeans appear to be transitioning from a downtrend toward consolidation.
A recovery above roughly 1284-1287 would be the first sign of improving momentum.
Among the grain markets, soybeans currently show the best potential for a bullish reversal.
Soybeans remain bearish, with fresh selling pressure on October 15. However, the relatively narrow gap between the 7- and 14-day moving averages leaves open the possibility of stabilization if prices recover above 1,284-1,287¢.
Fresh weakness: October 15 fell 14.25¢, or 1.12%.
Lower highs and closes: Prices have weakened across the latest four sessions.
Moving-average direction: The 7-day average is declining faster than the 21-day average, consistent with short-term momentum weakening.
Support to watch: 1,262.25¢, the October 15 low.
Resistance to watch: 1,277–1,284¢, followed by the 14-day MA at 1,286.70¢.
Signal: Soybeans have the weakest latest daily percentage performance of the three markets. A break below 1,262.25¢ would indicate additional near-term weakness.
Dec ’26 Wheat — Bearish trend with a possible pause
Bearish, watching for stabilization
Failed rebound: Wheat rose 4¢ on October 14 but fell 3.25¢ on October 15.
Lower trend: The 7-, 14-, and 21-day averages are all declining.
Support to watch: 667.25¢, followed by the October 14 low of 663¢ and October 9 low of 661.50¢.
Resistance to watch: 675–682¢, where the 7-day average and recent trading levels sit.
Signal: Wheat is bearish, but a sustained move above 675–682¢ would be an early sign that selling pressure is easing.
Trade Ideas
Call to discuss a plan moving forward.

Tim Healy
Broker
Pure Hedge Division
Direct: 312 957 4731
WALSH TRADING INC.
311 S. Wacker Suite 540
Chicago, Illinois 60606
Walsh Trading, Inc. is registered as a Guaranteed Introducing Broker with the Commodity Futures Trading Commission and an NFA Member.
Futures and options trading involves substantial risk and is not suitable for all investors. Therefore, individuals should carefully consider their financial condition in deciding whether to trade. Option traders should be aware that the exercise of a long option will result in a futures position. The valuation of futures and options may fluctuate, and as a result, clients may lose
more than their original investment. The information contained on this site is the opinion of the writer or was obtained from sources cited within the commentary. The impact on market prices due to seasonal or market cycles and current news events may already be reflected in market prices. PAST PERFORMANCE IS NOT NECESSARILY INDICATIVE OF FUTURE RESULTS.
All information, communications, publications, and reports, including this specific material, used and distributed by Walsh Trading, Inc. (“WTI”) shall be construed as a solicitation for entering into a derivatives transaction. WTI does not distribute research reports, employ research analysts, or maintain a research department as defined in CFTC Regulation 1.71.