


Is Oppenheimer Holdings (OPY) Cheap After Falling To $103?
Oppenheimer Holdings (OPY) has moved sharply lower in recent trading, with the share price around $103 after declines over the past week, month, and past 3 months. That pullback is drawing fresh attention to the stock’s valuation.
Short term momentum has cooled, with the share price down 3.69% over the past day and 13.79% over 30 days. However, Oppenheimer Holdings still shows strong longer term gains, with a 1 year total shareholder return of 51.64% and a 3 year total shareholder return above 200%, which keeps valuation firmly in focus.
Scan beyond Oppenheimer Holdings and consider other financial firms that have pulled back after strong multi year runs with the hand picked 32 high quality undervalued stocks.
After a run like this and a pullback to about $103, the gap between Oppenheimer Holdings' current price and various fair value estimates becomes more important. Where does that spread really place the stock today?
Price-to-Earnings of 10.7x: Is it justified?
On basic valuation math, Oppenheimer Holdings trades on a P/E of 10.7x, which places the $103 share price well below both the wider US market and the Capital Markets peer group on this metric.
The P/E ratio compares what investors are paying today for each dollar of earnings. For a diversified broker dealer and investment bank like Oppenheimer Holdings, this measure often reflects how confident the market is in the durability of fee income, trading results, and advisory pipelines rather than just one year of profit.
OPY is described as good value on this yardstick compared with the US market, where the average P/E sits at 18.1x. It is also highlighted as good value against the US Capital Markets industry, which carries a much higher average multiple of 37.6x. That wide gap suggests investors are applying a clear discount to Oppenheimer Holdings' earnings, despite recent 1 year profit growth of 17.5% and a track record of high quality earnings.
See what the numbers say about this price — find out in our valuation breakdown.
Result: Price-to-Earnings of 10.7x (UNDERVALUED).
At the same time, there is a different lens on value from the SWS DCF model. On that approach, OPY at $103 is trading above an estimated future cash flow value of $69.64. This frames the stock as expensive relative to the cash flows that model projects.
The DCF method takes expected future cash flows, discounts them back to today at a chosen rate, and aggregates the result into a single fair value estimate. It is a cash flow focused view that can weigh heavily on assumptions about growth, profitability, and the risk profile of a capital markets focused business.
For Oppenheimer Holdings, the contrast between a low P/E and a DCF value below the current price underlines how different models can tell opposing stories about the same ticker. Investors who lean more on earnings based benchmarks may see room in the multiple. By contrast, those who emphasise modeled cash flows may conclude the current quote already bakes in plenty of optimism.
Look into how the SWS DCF model arrives at its fair value.
Result: DCF Fair value of $69.64 (OVERVALUED).
Still, the Oppenheimer Holdings story can shift quickly if capital markets activity slows or if higher funding costs start to squeeze profitability assumptions embedded in those models.
Find out about the key risks to this Oppenheimer Holdings narrative.
Another View on Oppenheimer Holdings' DCF Value
The SWS DCF model presents a different perspective for Oppenheimer Holdings. At a share price of $103, the stock appears overvalued compared with an estimated future cash flow value of $69.64. That gap raises a simple question for you as an investor: which story carries more weight, the earnings multiple or the cash flow model?
Look into how the SWS DCF model arrives at its fair value.
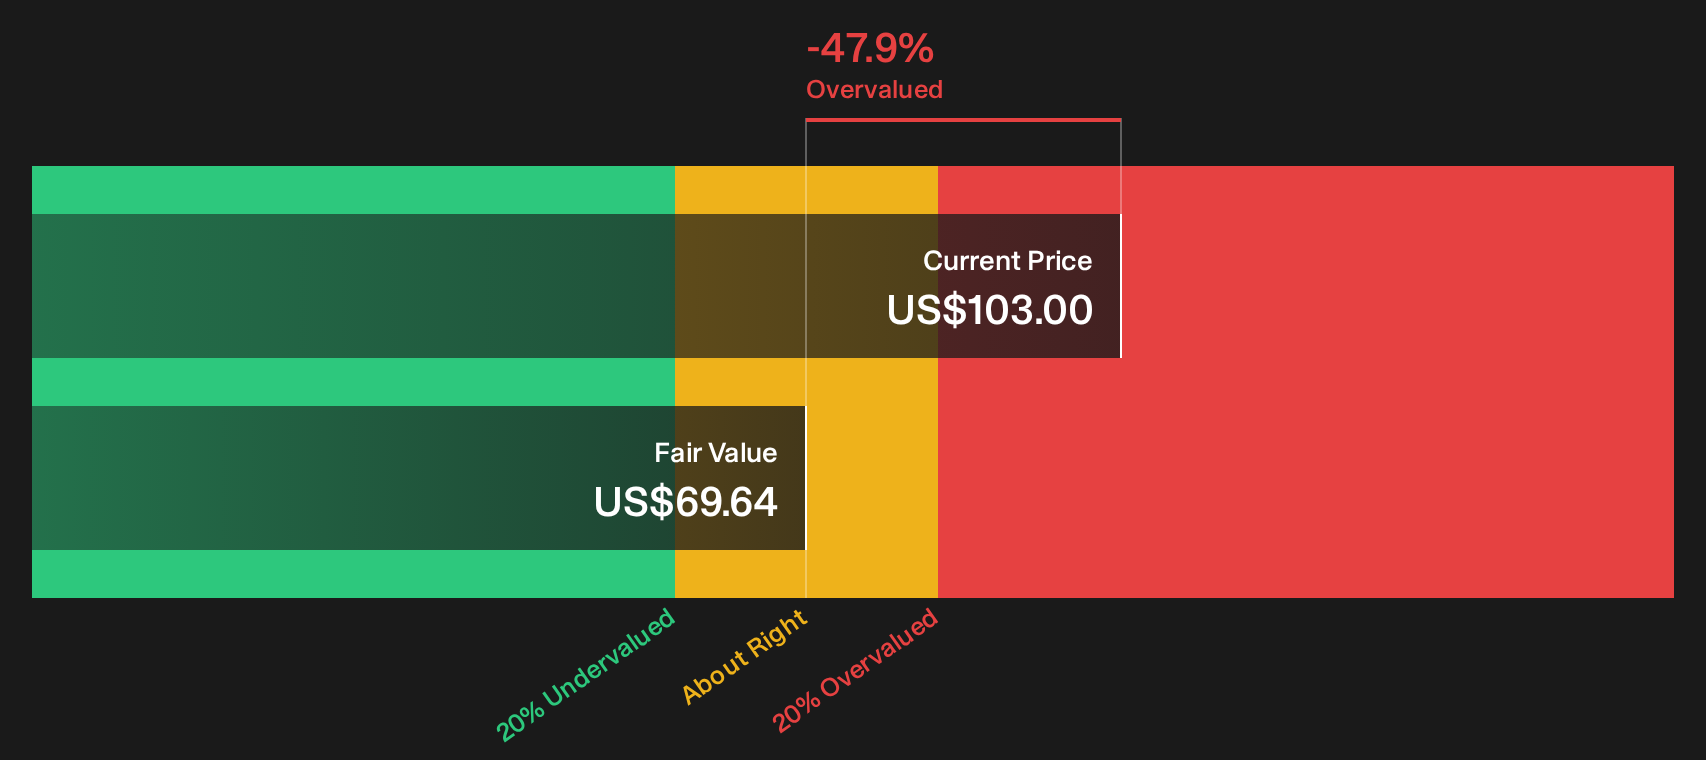
Simply Wall St performs a discounted cash flow (DCF) on every stock in the world every day (check out Oppenheimer Holdings for example). We show the entire calculation in full. You can track the result in your watchlist or portfolio and be alerted when this changes, or use our stock screener to discover 32 high quality undervalued stocks. If you save a screener we even alert you when new companies match - so you never miss a potential opportunity.
Next Steps
Mixed signals on Oppenheimer Holdings so far. If you want to move past the headline metrics and pressure test the story yourself, start with the 1 key reward and 1 important warning sign.
Looking for more investment ideas beyond Oppenheimer Holdings?
If Oppenheimer Holdings has sharpened your focus on valuation and risk, do not stop here. Broaden your watchlist with ideas shaped by different filters and financial profiles.
- Target potential mispricing by scanning the 32 high quality undervalued stocks that combine stronger fundamentals with lower market expectations.
- Strengthen portfolio resilience by reviewing a 32 resilient stocks with low risk scores that screens for sturdier balance sheets and milder drawdowns.
- Get ahead of the crowd by checking a 20 high quality undiscovered gems before attention and capital move elsewhere.
This article by Simply Wall St is general in nature. We provide commentary based on historical data and analyst forecasts only using an unbiased methodology and our articles are not intended to be financial advice. It does not constitute a recommendation to buy or sell any stock, and does not take account of your objectives, or your financial situation. We aim to bring you long-term focused analysis driven by fundamental data. Note that our analysis may not factor in the latest price-sensitive company announcements or qualitative material. Simply Wall St has no position in any stocks mentioned.
Have feedback on this article? Concerned about the content? Get in touch with us directly. Alternatively, email editorial-team@simplywallst.com