


Toho (TSE:9602) Just Moved, So What Is Behind The Attention?
Toho (TSE:9602) just lifted its earnings guidance for the fiscal year ending February 2027, citing gains from a partial sale of investment securities. This move immediately reframes how you might think about its profitability profile.
Recent trading suggests investors are still weighing that guidance upgrade. The share price is now ¥1,562.5, with a 90 day share price return of 9.27%, while the 1 year total shareholder return has declined 15.54%. This indicates that longer term momentum looks softer even as shorter term sentiment improves around Toho.
Spot opportunities beyond Toho by scanning a curated 72 high quality undiscovered gems that may also be moving on fresh guidance, reratings, or under-the-radar corporate actions.So the live question is whether Toho’s latest move mostly reveals something new about the underlying film and real estate engine, or whether it is more about investors reacting to a one off securities gain as the valuation resets next.
Preferred P/E of 26.9x for Toho: Is it justified?
On simple earnings terms, Toho trades on a P/E of 26.9x, which prices the shares at ¥1,562.5 in the context of steady but not rapid profit forecasts.
The P/E ratio compares the current share price to earnings per share and is often used for mature media and entertainment businesses where cash flows are relatively established. For Toho, consistent profit growth over the past five years and high quality earnings help explain why investors are willing to pay a higher multiple for each yen of profit.
The current multiple looks cheaper than the peer group average of 33.5x, which suggests the stock is priced below similar earnings valuations in that comparison set. At the same time, the P/E is higher than the broader JP Entertainment industry average of 16.3x and above an estimated fair P/E of 22.8x. This points to the market already baking in a relatively rich earnings outlook that could moderate if expectations cool.
Explore the SWS fair ratio for Toho.
Result: Price-to-earnings of 26.9x (OVERVALUED)
Still, Toho faces a softer 1 year total return and a recent 30 day share price decline, which could quickly puncture confidence if sentiment changes.
Find out about the key risks to this Toho narrative.
Another View on Toho’s Value: Cash Flows Paint a Different Picture
The earnings multiple presents Toho as only slightly rich, yet the SWS DCF model is more conservative. At ¥1,562.5, the share price sits above an estimated future cash flow value of ¥1,017.22, which suggests that Toho may be overvalued if those long-term cash assumptions hold.
This kind of gap can matter in practice. If earnings remain solid but cash generation tracks closer to the DCF path, investors are paying a premium today for cash flows that the model values at a lower level. The key question is how comfortable investors are with that trade-off.
Look into how the SWS DCF model arrives at its fair value.
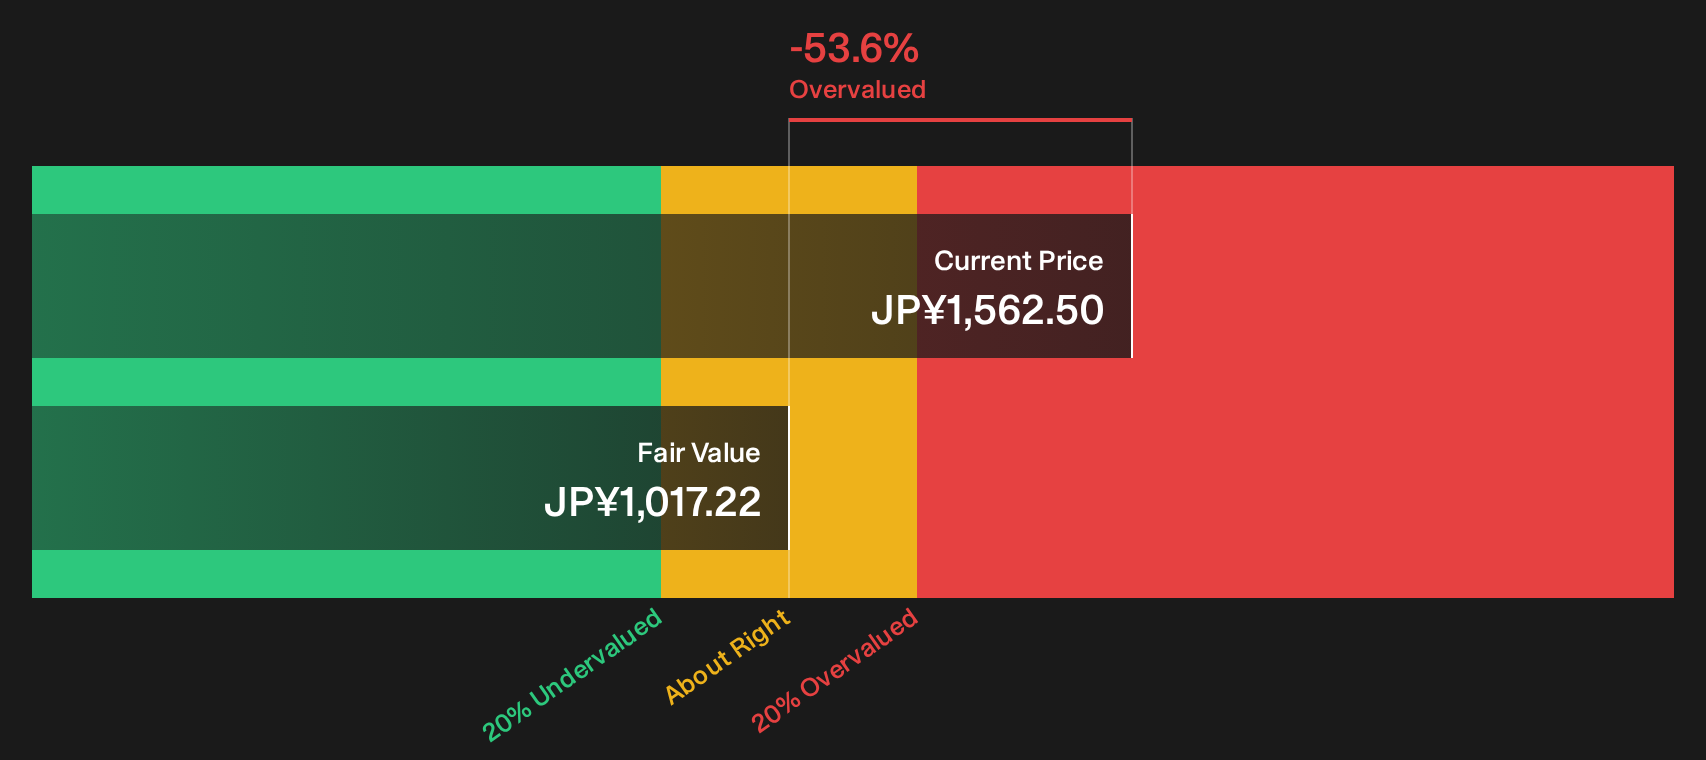
Simply Wall St performs a discounted cash flow (DCF) on every stock in the world every day (check out Toho for example). We show the entire calculation in full. You can track the result in your watchlist or portfolio and be alerted when this changes, or use our stock screener to discover 15 high quality undervalued stocks. If you save a screener we even alert you when new companies match - so you never miss a potential opportunity.
Next Steps
Sentiment in this review might feel cautious, yet the market rarely waits for absolute clarity. Move quickly to weigh Toho’s trade offs and potential. To understand why some investors still see upside in its profile, take a look at the 2 key rewards
Looking for more ideas beyond Toho?
If Toho has sharpened your sense of what valuation really means, do not stop here. Use the Simply Wall Street Screener to quickly surface fresh, high conviction ideas that fit your style.
- Target resilience first and protect your downside by filtering for 21 resilient stocks with low risk scores that score well on both fundamentals and risk.
- Hunt for mispriced quality and focus your research on 15 high quality undervalued stocks where solid businesses may be trading at a discount.
- Prioritize financial strength and skip fragile balance sheets by starting with a list of solid balance sheet and fundamentals (21 results) that highlights robust funding and cleaner leverage profiles.
This article by Simply Wall St is general in nature. We provide commentary based on historical data and analyst forecasts only using an unbiased methodology and our articles are not intended to be financial advice. It does not constitute a recommendation to buy or sell any stock, and does not take account of your objectives, or your financial situation. We aim to bring you long-term focused analysis driven by fundamental data. Note that our analysis may not factor in the latest price-sensitive company announcements or qualitative material. Simply Wall St has no position in any stocks mentioned.
Have feedback on this article? Concerned about the content? Get in touch with us directly. Alternatively, email editorial-team@simplywallst.com