


ARIAKE JAPAN (TSE:2815) Completes Buyback, Is The Stock Already Fully Valued?
ARIAKE JAPAN (TSE:2815) has wrapped up its previously announced share repurchase, buying 616,400 shares, or 1.94% of its outstanding equity, for ¥3,303.44 million by September 30, 2026.
The completed repurchase comes at a time when ARIAKE JAPAN’s recent 1-day and 7-day share price returns of 1.35% and 2.34% contrast with a year-to-date share price decline of 2.05% and a 1-year total shareholder return fall of 2.62%. However, the 3-year total shareholder return gain of 22.21% indicates that longer-term momentum has been stronger than the more mixed recent trend.
Scan how ARIAKE JAPAN compares with other businesses that have been hand-picked for resilient balance sheets and steady fundamentals through our list of solid balance sheet and fundamentals (21 results) today.
After a modest share price lift and a completed ¥3.3b buyback behind ARIAKE JAPAN, the real question now is whether the valuation still leaves meaningful upside on the table or if most of the easy gains have already passed.
Price-to-Earnings of 18.2x: Is it justified for ARIAKE JAPAN?
On the latest close at ¥5,250, ARIAKE JAPAN trades on a P/E of 18.2x, which positions the stock on the richer side compared to both its industry and peer group.
The P/E ratio compares the current share price with earnings per share and gives a quick sense of how much investors are paying for each unit of profit. For a food and seasoning producer like ARIAKE JAPAN, where earnings forecasts are described as growing but not significantly and at a slower pace than the wider JP market, that multiple suggests a market that may be paying a premium for stability and quality of earnings rather than rapid expansion.
Relative to the JP Food industry average of 16.2x, ARIAKE JAPAN’s 18.2x P/E appears clearly higher. The comparison with the peer average of 13.5x is even more pronounced and points to a stock priced above many similar businesses. The estimated fair P/E of 15.8x is meaningfully below the current level, which indicates that the market could eventually move closer to that lower ratio if expectations change.
Explore the SWS fair ratio for ARIAKE JAPAN.
Result: Price-to-Earnings of 18.2x (OVERVALUED)
Still, ARIAKE JAPAN’s premium P/E leaves little room for earnings disappointments or for slower revenue growth, which could put pressure on the current share price.
Find out about the key risks to this ARIAKE JAPAN narrative.
Another view on ARIAKE JAPAN’s valuation
The SWS DCF model paints a different picture for ARIAKE JAPAN. At a share price of ¥5,250, the stock is trading well above an estimated future cash flow value of ¥2,990.84, which points to an overvalued reading rather than hidden upside.
That kind of gap can matter because it leaves less of a cushion if earnings progress slows or expectations reset, even for a business with high quality earnings and steady profit growth forecasts. Look into how the SWS DCF model arrives at its fair value.
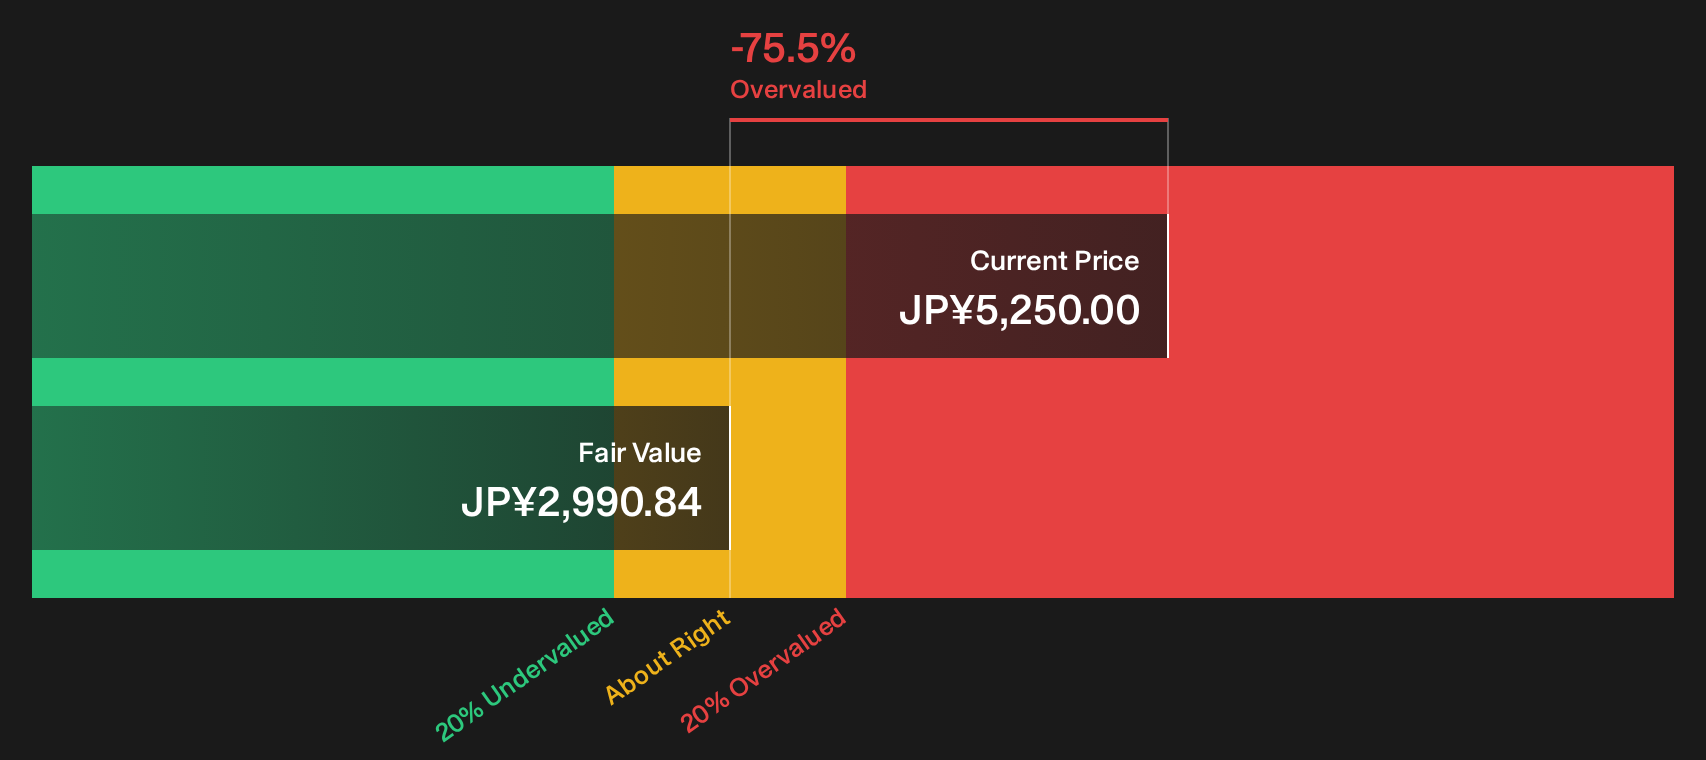
Simply Wall St performs a discounted cash flow (DCF) on every stock in the world every day (check out ARIAKE JAPAN for example). We show the entire calculation in full. You can track the result in your watchlist or portfolio and be alerted when this changes, or use our stock screener to discover 15 high quality undervalued stocks. If you save a screener we even alert you when new companies match - so you never miss a potential opportunity.
Next Steps
Plenty in this ARIAKE JAPAN story points to caution, yet the market still prices in some strengths that investors clearly like. If you want to move quickly and judge whether those positives outweigh the risks for your own portfolio, start by reviewing the 3 key rewards.
Looking for more ideas beyond ARIAKE JAPAN?
If ARIAKE JAPAN has sharpened your focus on valuation and quality, do not stop here. Broader idea hunting with structured screeners can reveal opportunities you would otherwise miss.
- Target resilient balance sheets and consistent fundamentals by reviewing a list of solid balance sheet and fundamentals (21 results) that filters for financially sturdy businesses.
- Spot potential mispriced opportunities by scanning a 15 high quality undervalued stocks that prioritises strong cash flows and robust financial health.
- Build an income focused watchlist by checking a 32 dividend fortresses that highlights companies offering higher yields with an emphasis on stability.
This article by Simply Wall St is general in nature. We provide commentary based on historical data and analyst forecasts only using an unbiased methodology and our articles are not intended to be financial advice. It does not constitute a recommendation to buy or sell any stock, and does not take account of your objectives, or your financial situation. We aim to bring you long-term focused analysis driven by fundamental data. Note that our analysis may not factor in the latest price-sensitive company announcements or qualitative material. Simply Wall St has no position in any stocks mentioned.
Have feedback on this article? Concerned about the content? Get in touch with us directly. Alternatively, email editorial-team@simplywallst.com