


Is Callaway Golf (CALY) Expensive Following Revenue Pressure And Lower Cash Flow Expectations?
Recent commentary around Callaway Golf (CALY) centers on falling annual revenue, a projected 11.5 percentage point drop in free cash flow margin next year, and divided analyst views on whether the current valuation reflects these business pressures.
Recent price moves show momentum fading. Callaway Golf’s share price has fallen 11.3% over the past month and 30.4% over the last quarter, even though the year to date share price return is up 15.5% and the 1 year total shareholder return is 45.6%.
Scan how Callaway Golf compares with other consumer names under pressure by sizing up the 32 high quality undervalued stocks that combine solid cash generation with more conservative pricing.
Callaway Golf is still throwing off cash and posting profit, even as the share price has slid hard in recent months. Does that recent drop leave the stock priced for those pressures already, or is it still leaning on too much optimism?
Price-to-Earnings of 30x: Is it justified?
On simple headline math, Callaway Golf trades on a P/E of 30x while the last close sits at $13.54, and that puts the stock on a richer earnings tag than many leisure peers.
The P/E ratio compares what investors are paying today for each dollar of earnings. For a business like Callaway Golf that sells equipment and apparel rather than high growth software, this kind of valuation usually implies the market is willing to pay up for future profit improvement or for perceived quality of the earnings stream.
Here, the number is doing a lot of work. The 30x P/E sits well above the global leisure industry average of 17.4x and over the peer group average of 20.9x, and it is also slightly above the estimated fair P/E of 29.1x that our fair ratio suggests the market could move toward over time.
Explore the SWS fair ratio for Callaway Golf.
Result: Price-to-Earnings of 30x (OVERVALUED)
Still, the story can change quickly if Callaway Golf’s high P/E meets weaker consumer demand, or if cash generation falls short of the current narrative.
Find out about the key risks to this Callaway Golf narrative.
Another View on Callaway Golf’s Value
The P/E math presents Callaway Golf as expensive, yet the SWS DCF model suggests a different conclusion. On that cash flow view, CALY at $13.54 trades below an estimated value of $27.98, which frames the current quote as discounted rather than stretched. Which perspective do you rely on more: earnings multiple or future cash flows?
Look into how the SWS DCF model arrives at its fair value.
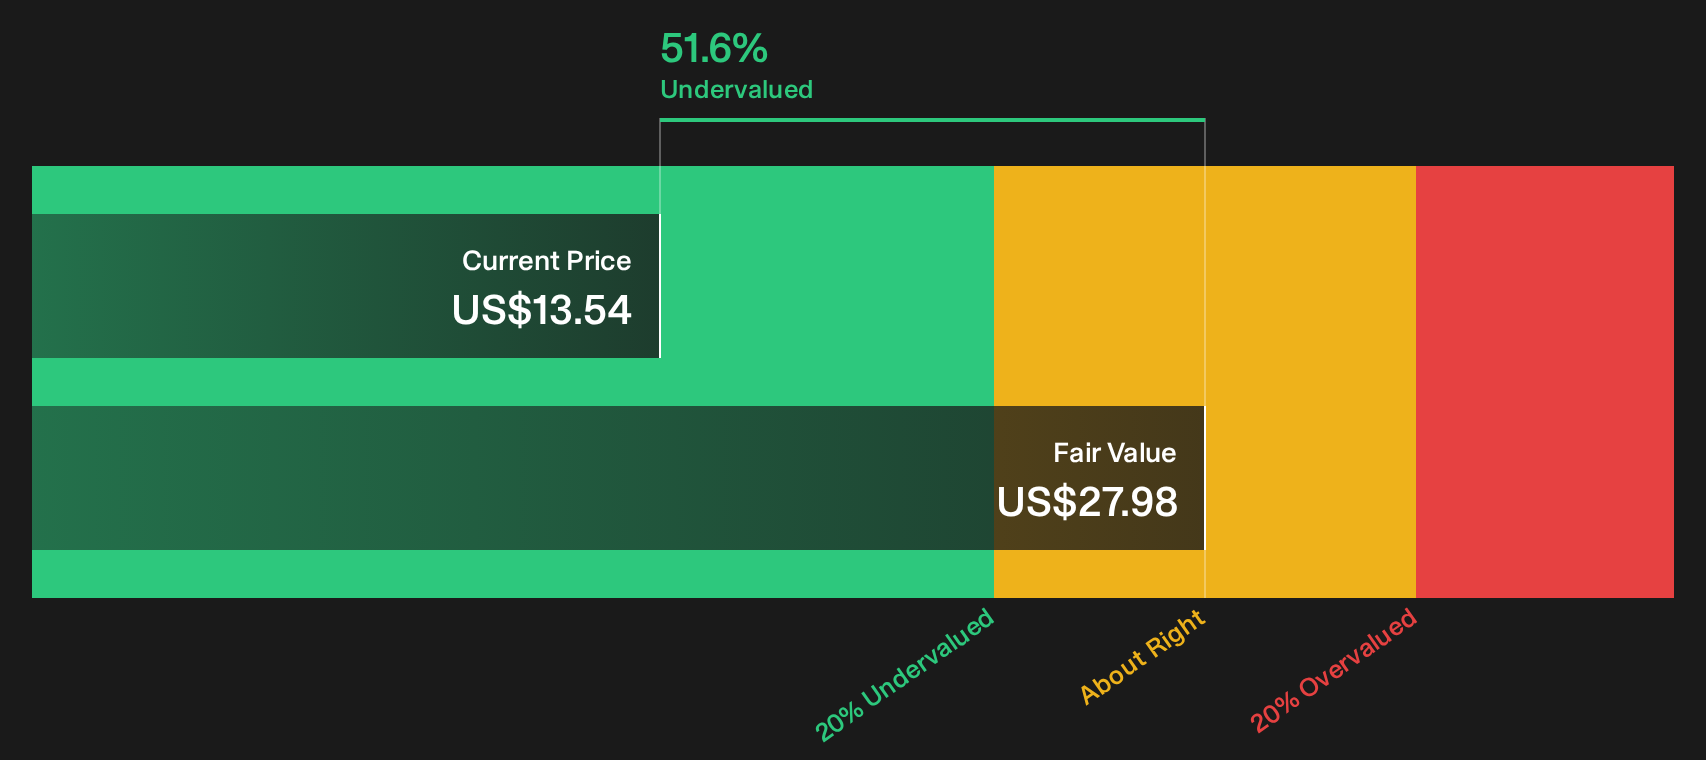
Simply Wall St performs a discounted cash flow (DCF) on every stock in the world every day (check out Callaway Golf for example). We show the entire calculation in full. You can track the result in your watchlist or portfolio and be alerted when this changes, or use our stock screener to discover 32 high quality undervalued stocks. If you save a screener we even alert you when new companies match - so you never miss a potential opportunity.
Next Steps
Mixed signals around Callaway Golf’s valuation and cash flow story make this a stock you need to judge for yourself. Consider moving quickly, reviewing both the risks and the upside, and weighing how they fit your own goals with the 3 key rewards and 2 important warning signs
Looking for more investment ideas beyond Callaway Golf?
If Callaway Golf has you thinking harder about price, quality, and risk, do not stop here. Use these focused stock lists to pressure test your next moves.
- Target steadier potential by reviewing companies with resilient balance sheets and robust fundamentals through this list of solid balance sheet and fundamentals (25 results).
- Hunt for mispriced opportunities by scanning the 20 high quality undiscovered gems that pair strong financials with limited market attention.
- Prioritize capital protection by checking companies that score well on stability and risk using the 32 resilient stocks with low risk scores.
This article by Simply Wall St is general in nature. We provide commentary based on historical data and analyst forecasts only using an unbiased methodology and our articles are not intended to be financial advice. It does not constitute a recommendation to buy or sell any stock, and does not take account of your objectives, or your financial situation. We aim to bring you long-term focused analysis driven by fundamental data. Note that our analysis may not factor in the latest price-sensitive company announcements or qualitative material. Simply Wall St has no position in any stocks mentioned.
Have feedback on this article? Concerned about the content? Get in touch with us directly. Alternatively, email editorial-team@simplywallst.com