


Dynex Capital (DX) Stock Still Looks Reasonable After Its 49% Three Year Run
Dynex Capital has delivered a 3 year gain that looks very different to its more recent share price pullback, which naturally raises the question of whether the current US$10.84 price still lines up with what its earnings can support. With that mixed return profile in the background, investors are asking how much of Dynex Capital's earning power is already reflected in the valuation.
- Over the past 3 years the stock has gained 49.2%, which puts real weight on the question of whether the current earnings base can justify the rerating.
- The business relies heavily on how efficiently it turns its interest spread into profits, so small shifts in funding costs or asset yields can have a meaningful impact on the earnings that underpin today’s P/E.
- The analysts covering Dynex Capital have run their own numbers. See what analysts think Dynex Capital's shares could be worth.
The issue now is whether Dynex Capital's current share price is adequately supported by the level and quality of its earnings.
If you want to stress test this same earnings question beyond Dynex Capital, take a look at a broader group of 32 high quality undervalued stocks.
Is Dynex Capital a Bargain on Earnings?
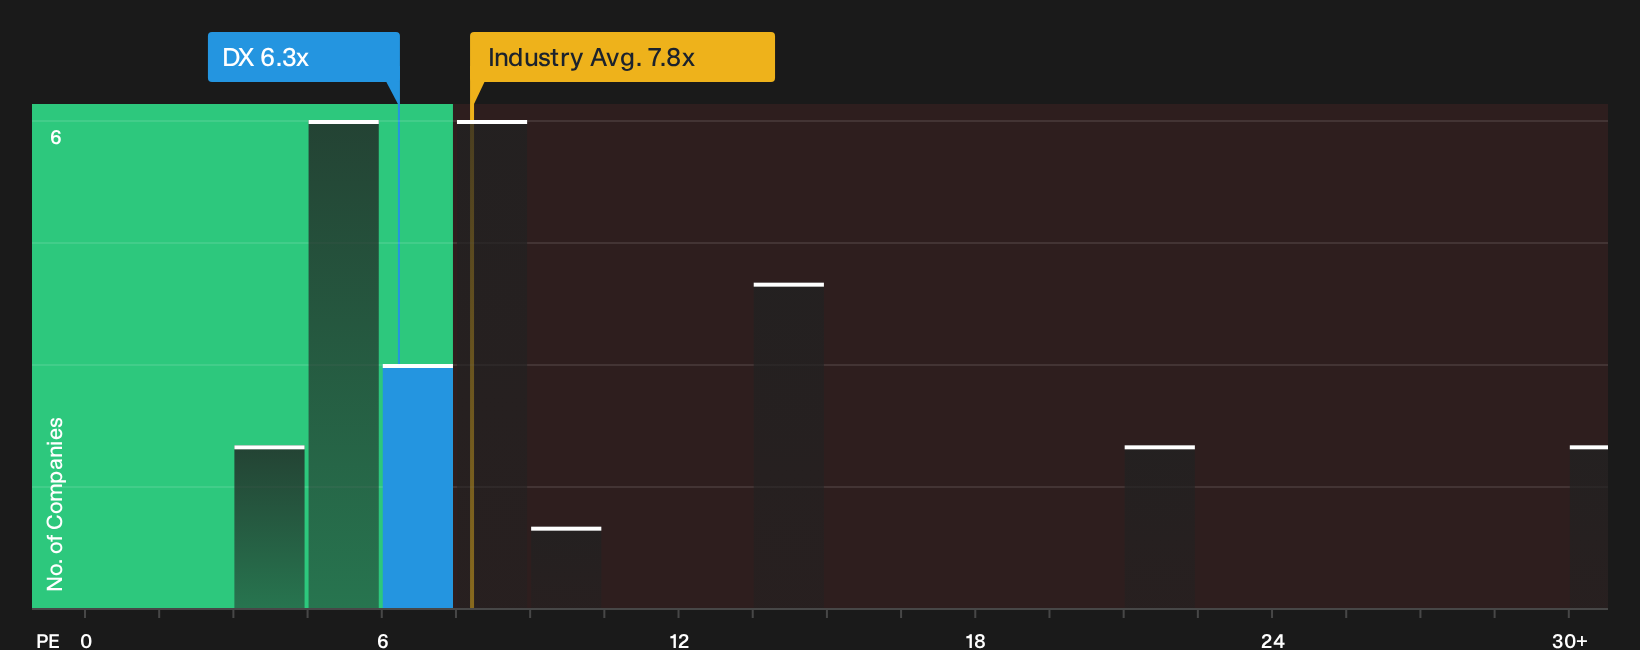
The P/E ratio fits Dynex Capital because earnings are the main anchor for how investors judge a mortgage REIT like this. The stock trades on a P/E of 6.3x, which is lower than the Mortgage REITs industry average of 7.8x and above the peer group average of 4.8x. That places Dynex Capital between a cheaper peer cluster and a pricier broader sector, which gives a mixed message on how the market is weighing its income stream and risk profile.
A tailored fair-value P/E that blends factors like Dynex Capital's profitability, scale and sector risks comes out higher than where the shares trade today, so the current 6.3x screens as undervalued on this framework. For an income-focused vehicle where the interest spread and funding costs drive the bottom line, that kind of gap suggests the current price may not fully reflect the earnings power implied by the model. Explore the numbers behind Dynex Capital's P/E valuation.
The Dynex Capital Narrative: What Would Justify Today's Price?
Simply Wall St Narratives pick up where Dynex Capital's P/E puzzle leaves off. They spell out which paths for Dynex Capital's earnings, margins and balance sheet would need to play out for the share price to look materially higher or lower than today. Each narrative ties a specific fair value to one clear story about potential catalysts and key risks so you can track which version of events the market seems to be rewarding over time on the Community page.
A clear, number driven narrative on Dynex Capital right now gives you a concrete set of earnings and valuation assumptions to test against reality as fresh results arrive. It turns a loose view on where its growth, margins and execution go from here into a trackable roadmap that can be updated as the data either supports or challenges that story.
Share your own Narrative for Dynex Capital and set out the assumptions behind your valuation.
One more Dynex Capital check that belongs beside the earnings multiple
Price and profits only tell part of the story for Dynex Capital, because the people steering the portfolio and how they are rewarded can tilt risk and reward in ways the P/E alone cannot capture. See who runs Dynex Capital and how they are paid.
This article by Simply Wall St is general in nature. We provide commentary based on historical data and analyst forecasts only using an unbiased methodology and our articles are not intended to be financial advice. It does not constitute a recommendation to buy or sell any stock, and does not take account of your objectives, or your financial situation. We aim to bring you long-term focused analysis driven by fundamental data. Note that our analysis may not factor in the latest price-sensitive company announcements or qualitative material. Simply Wall St has no position in any stocks mentioned.
Have feedback on this article? Concerned about the content? Get in touch with us directly. Alternatively, email editorial-team@simplywallst.com