


Is Hulic (TSE:3003) Undervalued On Its San Jose Rental Property Deal?
Hulic (TSE:3003) has joined Kennedy Wilson and Fuyo General Lease (USA) Inc. in a three party venture to acquire One South Market, a 312 unit multifamily property in San Jose.
The Hulic share price has eased about 7% over the past three months and is down roughly 4% year to date, yet total shareholder return of 12% over one year and 79% over five years signals momentum that has built over time rather than faded.
Scan beyond Hulic's latest US rental deal and line it up against other real estate groups with resilient balance sheets using our hand picked list of solid balance sheet and fundamentals (21 results)
Bulls see Hulic using joint ventures such as One South Market to extend a diversified real estate engine. Bears focus on the recent share price drift. Which case fits the valuation you are paying today?
Preferred P/E of 10.6x for Hulic: Is it justified?
Valuation hinges on what investors are willing to pay for each yen of Hulic's earnings. The current P/E of 10.6x provides a clear reference point against both the broader JP market and real estate peers.
The P/E ratio compares the share price with earnings per share and is a common yardstick for property groups where earnings quality and stability matter as much as top line growth. For Hulic, the 10.6x multiple sits below the wider JP market level of 13.9x. This indicates that the stock trades at a lower price than the average listed company for each unit of profit.
Compared with the JP real estate industry, the picture shifts. Hulic changes hands at 10.6x earnings while the sector average sits at 9.6x, so investors are paying a higher multiple than for a typical domestic property peer. Yet based on Simply Wall St's fair P/E estimate of 15.8x for Hulic, the current market multiple is below a level the data suggests could be justified if conditions align with those assumptions.
Explore the SWS fair ratio for Hulic.
Result: Price-to-earnings of 10.6x (ABOUT RIGHT)
Still, the recent share price drift and Hulic's heavy exposure to Japan-focused real estate could pressure sentiment if rental demand or asset values weaken.
Find out about the key risks to this Hulic narrative.
Another View: Hulic Through a Cash Flow Lens
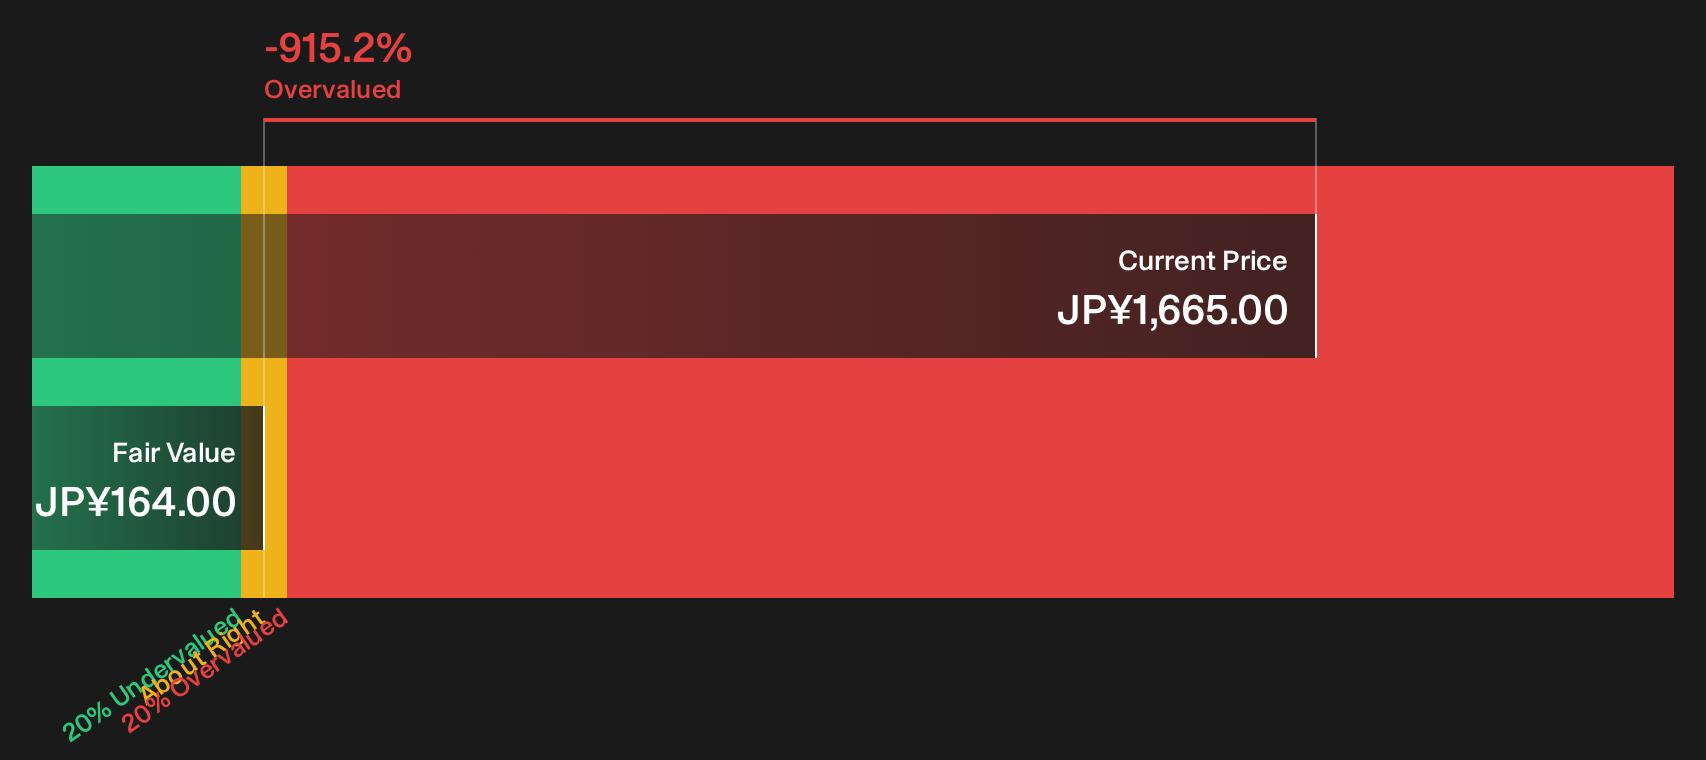
A second look at Hulic using the Simply Wall St DCF model paints a tougher picture. At ¥1,665 the shares are described as trading well above an estimated future cash flow value of ¥164. That gap points to limited margin for error if cash generation underwhelms.
Look into how the SWS DCF model arrives at its fair value.
Simply Wall St performs a discounted cash flow (DCF) on every stock in the world every day (check out Hulic for example). We show the entire calculation in full. You can track the result in your watchlist or portfolio and be alerted when this changes, or use our stock screener to discover 15 high quality undervalued stocks. If you save a screener we even alert you when new companies match - so you never miss a potential opportunity.
Next Steps
Mixed signals on Hulic's valuation and cash flows make this a judgment call, so review the underlying data quickly and weigh both the potential upside and the downside flagged in the 3 key rewards and 2 important warning signs
Looking for more Hulic sized investment ideas?
If Hulic has sharpened your thinking, use that momentum and let the Simply Wall St screener surface fresh opportunities that match your risk and return preferences.
- Target resilient balance sheets and steady fundamentals by scanning a curated list of solid balance sheet and fundamentals (21 results) that keeps financial strength front and center.
- Hunt for mispriced opportunities by reviewing a focused 15 high quality undervalued stocks where quality and valuation line up more cleanly than many headline tickers.
- Lock in income focused ideas by checking a hand picked 28 dividend fortresses that concentrates on higher yielding companies with staying power.
This article by Simply Wall St is general in nature. We provide commentary based on historical data and analyst forecasts only using an unbiased methodology and our articles are not intended to be financial advice. It does not constitute a recommendation to buy or sell any stock, and does not take account of your objectives, or your financial situation. We aim to bring you long-term focused analysis driven by fundamental data. Note that our analysis may not factor in the latest price-sensitive company announcements or qualitative material. Simply Wall St has no position in any stocks mentioned.
Have feedback on this article? Concerned about the content? Get in touch with us directly. Alternatively, email editorial-team@simplywallst.com