


MGE Energy (MGEE) Extends Credit Lines While Valuation Looks Roughly Fair
MGE Energy (MGEE) recently reworked its credit arrangements, extending key maturities to 2031 and expanding Madison Gas and Electric Company's JPMorgan facility to US$210 million. This reshapes the group’s available liquidity profile.
For shareholders, the backdrop has been softer, with the stock’s 30 day share price return down 8.2% and the year to date share price return lower by 10.5%, while the 3 year total shareholder return of 5.1% and 5 year total shareholder return of 4.2% point to modest long term gains that contrast with the recent loss of momentum.
Compare how MGE Energy’s funding shift stacks up against other balance sheet focused utilities by scanning our curated list of solid balance sheet and fundamentals (25 results) for your next research shortlist.
MGE Energy has shored up its credit lines while the share price has lost ground. Does that combination make today a reasonable entry point, or does it argue for patience and a lower price before committing fresh capital?
Preferred P/E of 17.7x: Is it justified?
MGE Energy trades on a P/E of 17.7x, which reflects the current $70.22 share price and frames how the market is weighing its steady earnings profile against other utilities.
The P/E ratio compares what investors pay for each dollar of earnings. For a regulated power and gas provider like MGE Energy, this metric is often used as a shorthand for how dependable its profit stream is viewed and how much future growth investors are willing to price in.
On one hand, the business has reported 14.2% earnings growth over the past year, ahead of its own 5 year average of 6.8% and above the US Electric Utilities industry figure of 9.1%. On the other hand, analysts expect earnings to rise 6.82% per year and revenue to grow 4.8% per year, which are both slower than the broader US market forecasts. The current valuation also sits just above an estimated fair P/E of 17.2x, which suggests the market could move closer to that level if sentiment cools.
Compared with peers, the picture skews more supportive for existing holders. The 17.7x P/E is lower than the peer average of 19.8x and below the broader US Electric Utilities industry average of 20.3x, which points to a discount against comparable regulated utilities even as it sits slightly rich to the internal fair ratio estimate.
Explore the SWS fair ratio for MGE Energy.
Result: Price-to-Earnings of 17.7x (ABOUT RIGHT)
Still, MGE Energy faces risks if regulated returns tighten or customer growth slows. These factors could pressure earnings and challenge today’s valuation narrative.
Find out about the key risks to this MGE Energy narrative.
Another View: SWS DCF Signals Overvaluation
The P/E makes MGE Energy look roughly in line with expectations, yet the SWS DCF model points in a different direction. On that lens, the current $70.22 share price sits above an estimated future cash flow value of $60.83, which frames the stock as overvalued on cash generation.
For investors who lean on intrinsic value estimates rather than earnings multiples, that gap can read as a valuation risk that reduces the margin of safety. The key question is whether you trust the earnings stability implied by the P/E, or the more conservative cash flow profile implied by the model.
Look into how the SWS DCF model arrives at its fair value.
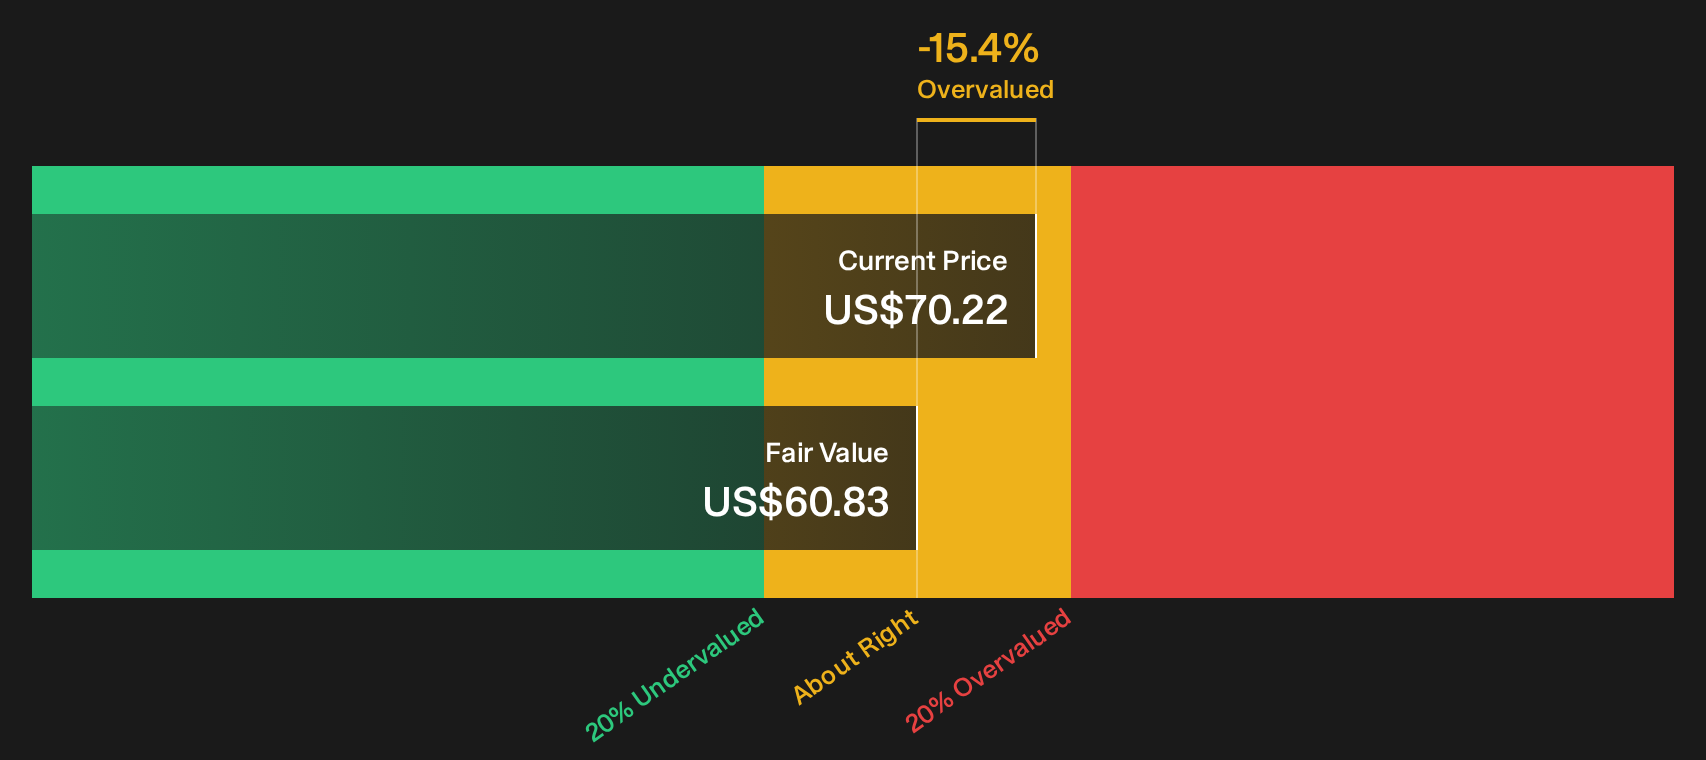
Simply Wall St performs a discounted cash flow (DCF) on every stock in the world every day (check out MGE Energy for example). We show the entire calculation in full. You can track the result in your watchlist or portfolio and be alerted when this changes, or use our stock screener to discover 29 high quality undervalued stocks. If you save a screener we even alert you when new companies match - so you never miss a potential opportunity.
Next Steps
Mixed messages on MGE Energy’s valuation story can cut both ways, so act promptly, review the data for yourself, and weigh the 3 key rewards and 2 important warning signs.
Looking for more investment ideas beyond MGE Energy?
If MGE Energy has you thinking harder about valuation and risk, use that momentum and line up a few fresh watchlist candidates before the market moves.
- Target resilient balance sheets and steady fundamentals by scanning our focused list of solid balance sheet and fundamentals (25 results) so you can quickly spot companies with financial muscle behind their operations.
- Hunt for quality at a potential discount by reviewing the 29 high quality undervalued stocks and see which businesses pair strong fundamentals with prices that have not fully caught up.
- Prioritise stability and income potential by checking the 8 dividend fortresses to find high yielding payouts that still rest on solid financial footing.
This article by Simply Wall St is general in nature. We provide commentary based on historical data and analyst forecasts only using an unbiased methodology and our articles are not intended to be financial advice. It does not constitute a recommendation to buy or sell any stock, and does not take account of your objectives, or your financial situation. We aim to bring you long-term focused analysis driven by fundamental data. Note that our analysis may not factor in the latest price-sensitive company announcements or qualitative material. Simply Wall St has no position in any stocks mentioned.
Have feedback on this article? Concerned about the content? Get in touch with us directly. Alternatively, email editorial-team@simplywallst.com