


Magna International Stock And 2 Canadian Dividend Stocks To Watch
Bond yields are surging worldwide, and higher income from safer assets is tempting many investors away from shares. For Canadian dividend investors, that raises the bar. Reliable cash payouts start to matter more than blue sky stories. Well covered dividends above 3% with a track record of stability and growth can offer a steady paycheque effect. This article highlights three of the strongest options from that income focused pool.
The three stocks below are just a sample of the income ideas that clear this higher bar, while the full screen surfaced 20 more companies with equally compelling narratives that are not covered here. To see the broader field and start to identify your own highest conviction income plays, head straight into the Dividend Powerhouses (3%+ Yield) screener.
Magna International (TSX:MG)
Overview: Magna International is a global automotive supplier that designs, engineers, and builds vehicle systems, complete cars, and key electrification and ADAS components for major manufacturers.
Operations: Magna generates most of its revenue from Body Exteriors & Structures at US$16.9b and Power & Vision at US$15.7b, with Seating Systems and Complete Vehicles adding US$5.9b and US$4.7b.
Market Cap: CA$24.2b
For a dividend screen built around >3% yields that are backed by real cash flows, Magna International offers something tangible, with long contracts supplying electrification and driver assistance hardware to global automakers anchoring the payout.
"Magna International is focusing on operational excellence and restructuring actions, which are expected to result in meaningful margin expansion over the next two years."
What really matters now is how one pressure on future cash generation resolves, because that will decide how dependable the yield feels.
If that pressure point matters to you, read the full narrative for Magna International to see how Magna International's cash engine and dividend story could be evolving next.

Freehold Royalties (TSX:FRU)
Overview: Freehold Royalties acquires mineral and royalty interests on producing oil and gas assets, collecting production linked payments that fund its dividend.
Operations: Freehold Royalties generates about CA$322 million from oil and gas exploration and production royalties, split between Canada at CA$157 million and the United States at CA$165 million.
Market Cap: CA$2.8b
Freehold Royalties matters for a dividend screen because its royalty model is built around turning oil and gas production into recurring cash distributions.
"Freehold leases its mineral rights or gross overriding royalty to third-party operators and receives a "top-line" share of each barrel of oil or gas produced, giving it operational netback margins ranging from 85% to 90% and one of the highest cash conversion ratios in the industry."
What happens to that income stream if one often overlooked pressure on how much cash reaches shareholders starts to shift direction?
If that shift is what you care about, go straight to the full narrative for Freehold Royalties to see how Freehold Royalties' high margin model could amplify or blunt future payouts.

North West (TSX:NWC)
Overview: North West Company runs grocery, discount and convenience stores across northern Canada, Alaska and select overseas regions, using these everyday shopping trips to support its high-yield dividend.
Operations: North West generates about CA$1.5b of revenue in Canada and CA$1.1b internationally from its network of retail formats.
Market Cap: CA$2.6b
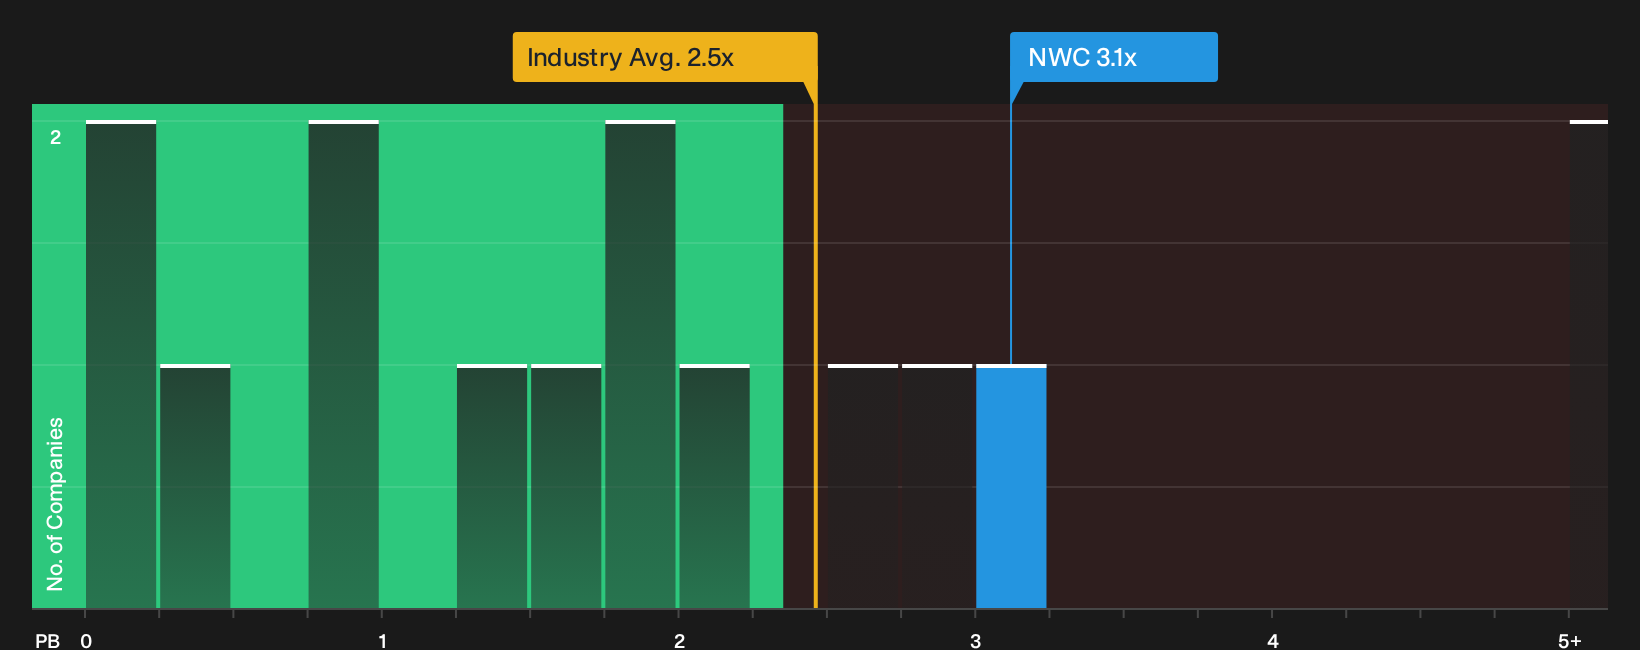
North West Company pairs a roughly 3.06% dividend yield with cash-rich food and essentials retailing across remote communities, supported by steady margins, solid earnings quality and a P/E below many consumer peers. For dividend-focused investors, one consideration is how routine grocery spending in these markets may continue to fund the dividend, depending on how a quieter pressure on future financing costs develops.
As that financing pressure builds in the background, use the North West financial health report to see whether North West's balance sheet quietly supports higher yield resilience ahead.
Seeking Alternatives Before The Crowd?
Fresh ideas move first. Strong balance sheets, building momentum and still under the radar for now. Scan these focused shortlists before prices move sharply higher or lower. Consider these tools while you research.
- Spot cash rich operators with room to compound by running the list of solid balance sheet and fundamentals (7 results) before other investors start focusing on the same balance sheet strength.
- Target resilient growers with muted volatility by scanning 7 resilient stocks with low risk scores while these steadier compounders still trade without momentum traders crowding in.
- Explore the build out of next generation grid infrastructure by screening 43 power grid technology and infrastructure stocks while these enablers of electrification remain under many investors' radars.
This article by Simply Wall St is general in nature. We provide commentary based on historical data and analyst forecasts only using an unbiased methodology and our articles are not intended to be financial advice. It does not constitute a recommendation to buy or sell any stock, and does not take account of your objectives, or your financial situation. We aim to bring you long-term focused analysis driven by fundamental data. Note that our analysis may not factor in the latest price-sensitive company announcements or qualitative material. Simply Wall St has no position in any stocks mentioned.
Have feedback on this article? Concerned about the content? Get in touch with us directly. Alternatively, email editorial-team@simplywallst.com