


Omnicom Group (OMC) Is Getting Attention, But What Is The Market Missing?
Omnicom Group (OMC) has returned to focus after reporting Q2 results that included 6.1% organic growth in core operations and wider margins, even as the share price weakened following the release.
For context, Omnicom Group’s share price is US$76.48, and the pattern over recent months has been choppy, with the stock down 3.2% over 30 days and 7.4% over 90 days, even as the 1-year total shareholder return of 4.1% and 5-year total shareholder return of 19.4% point to steadier long-run gains.
That mix of short-term share price weakness and positive multi year total shareholder returns suggests investors are reassessing near term risks and sector change around AI and data driven marketing more than they are the broader Omnicom Group equity story.
Compare how Omnicom Group stacks up against other advertising and media players adapting to AI and data driven marketing shifts by scanning our hand picked 20 high quality undiscovered gems.
Omnicom Group now trades at a sizeable discount to both analyst targets and some intrinsic value estimates after a solid Q2. Does that gap reflect mispricing, or is the market sensibly pricing AI and ad cycle risks?
Most Popular Narrative: 25% Undervalued
On the most followed view, Omnicom Group appears undervalued, with a fair value estimate of $102 compared with a last close of $76.48. This implies the current price trades at a steep discount if those long term assumptions hold.
The expanded cost reduction and portfolio pruning program, which now targets disposals of about US$3.5b to US$3.6b of largely lower growth revenue and gross cost synergies of US$1.5b by mid 2028, is designed to support higher Core Operations margins and EBITA growth as remaining businesses scale.
See why 43 investors see Omnicom Group as 25% undervalued.
Result: Fair Value of $102 (UNDERVALUED)
Still, Omnicom Group’s case could be upended if advertising weakness persists or if higher net interest costs absorb more of the operating profit.
Find out about the key risks to this Omnicom Group narrative.
Another View: Omnicom Group On Earnings Multiples
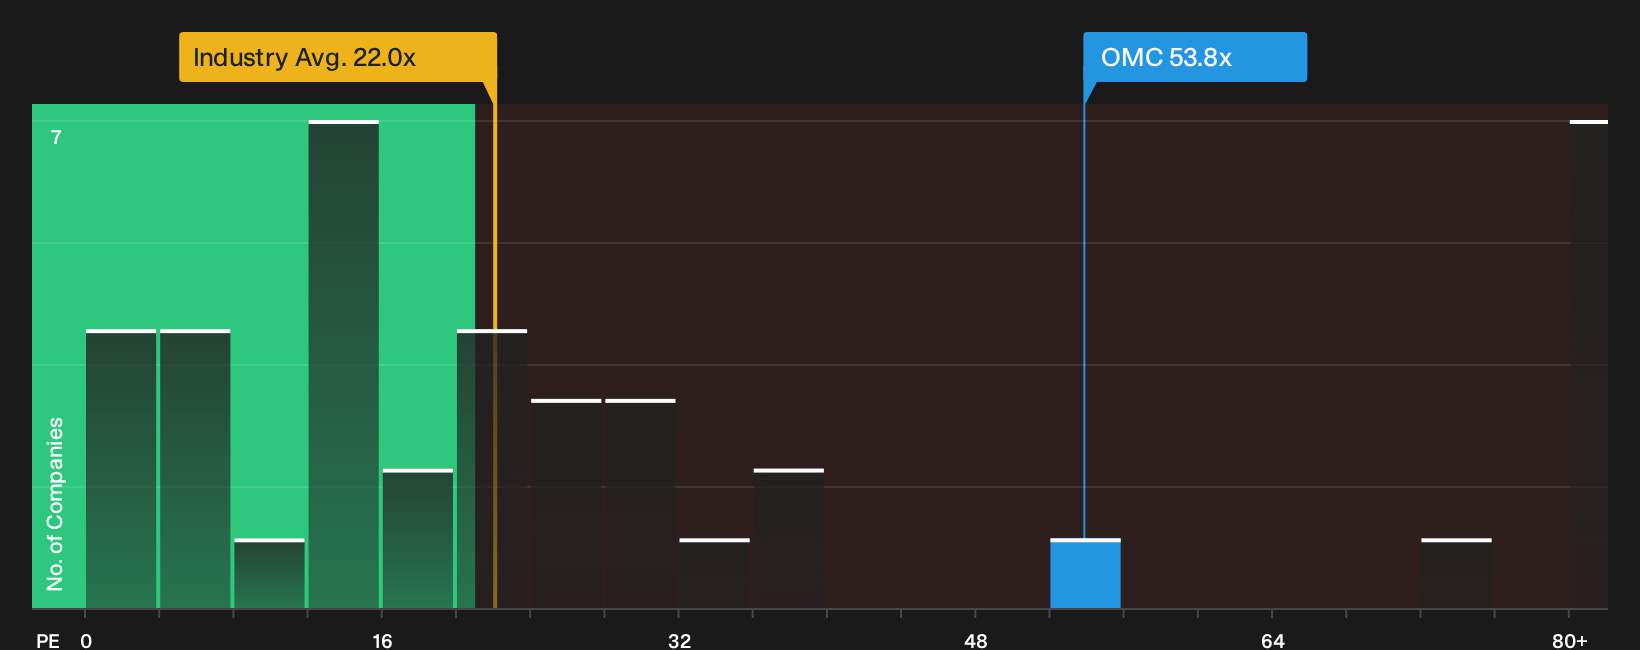
The story looks very different when you swap fair value models for plain P/E math. Omnicom Group trades at 53.8x earnings, compared with 22x for the wider US Media industry, a 23.1x peer average and a fair ratio of 27.9x that the market could eventually lean toward.
If sentiment shifts toward that fair ratio or closer to sector norms, the adjustment would come from the share price, not the earnings line. This raises real valuation risk for anyone leaning only on long term targets.
See what the numbers say about this price — find out in our valuation breakdown.
Next Steps
This mix of optimism and concern around Omnicom Group is exactly why the detail matters. Move quickly, test the numbers yourself, and pressure test both upside and downside using the 2 key rewards and 5 important warning signs.
Looking for more investment ideas beyond Omnicom Group?
If Omnicom Group has you curious about what else might be hiding in plain sight, do not stop here. Use the Simply Wall St screener tools to pressure test your next moves and avoid leaving potential opportunities on the table.
- Target quality at a discount by scanning 28 high quality undervalued stocks that combine stronger fundamentals with pricing that still looks reasonable on key metrics.
- Prioritise resilience by focusing on companies in the 31 resilient stocks with low risk scores that show steadier balance sheets and more measured risk profiles.
- Hunt for tomorrow’s overlooked winners by filtering the 20 high quality undiscovered gems where strong financials have not yet attracted broad market attention.
This article by Simply Wall St is general in nature. We provide commentary based on historical data and analyst forecasts only using an unbiased methodology and our articles are not intended to be financial advice. It does not constitute a recommendation to buy or sell any stock, and does not take account of your objectives, or your financial situation. We aim to bring you long-term focused analysis driven by fundamental data. Note that our analysis may not factor in the latest price-sensitive company announcements or qualitative material. Simply Wall St has no position in any stocks mentioned.
Have feedback on this article? Concerned about the content? Get in touch with us directly. Alternatively, email editorial-team@simplywallst.com