


Is Fujimi (TSE:5384) Fully Valued After Raising Guidance And Its Dividend?
Why Fujimi’s fresh guidance matters for shareholders
Fujimi (TSE:5384) has put new numbers on the table, lifting its earnings outlook for fiscal 2027 and issuing long range net sales guidance through fiscal 2029 and 2032.
The update follows stronger than expected results in the half year to September 2026, where firm demand for CMP materials and silicon wafer products supported higher forecasts for revenue, profit and dividends.
Fujimi’s raised guidance comes after a strong run in the shares, with the 1-year total shareholder return of 59.69% and year-to-date share price return of 54.07% pointing to building momentum even though the 90-day share price return declined 11.88%.
Capture how Fujimi’s raised guidance fits into a broader materials story by scanning a hand picked set of list of solid balance sheet and fundamentals (23 results) that may benefit from similar demand trends.Fujimi now trades well below both analyst targets and some intrinsic value estimates after a sharp move higher. Is that discount a genuine margin of safety, or is it the market’s way of flagging risk in the guidance story?
Preferred P/E of 25.8x: Is it justified?
Valuation on Fujimi today is being framed by a rich P/E of 25.8x at a last close of ¥3,670, even though the stock screens as materially below some intrinsic value estimates and analyst targets.
The P/E ratio compares what investors are currently paying for each unit of earnings to the profits the business is generating. It is especially closely watched for mature but still growing materials and semiconductor supply players.
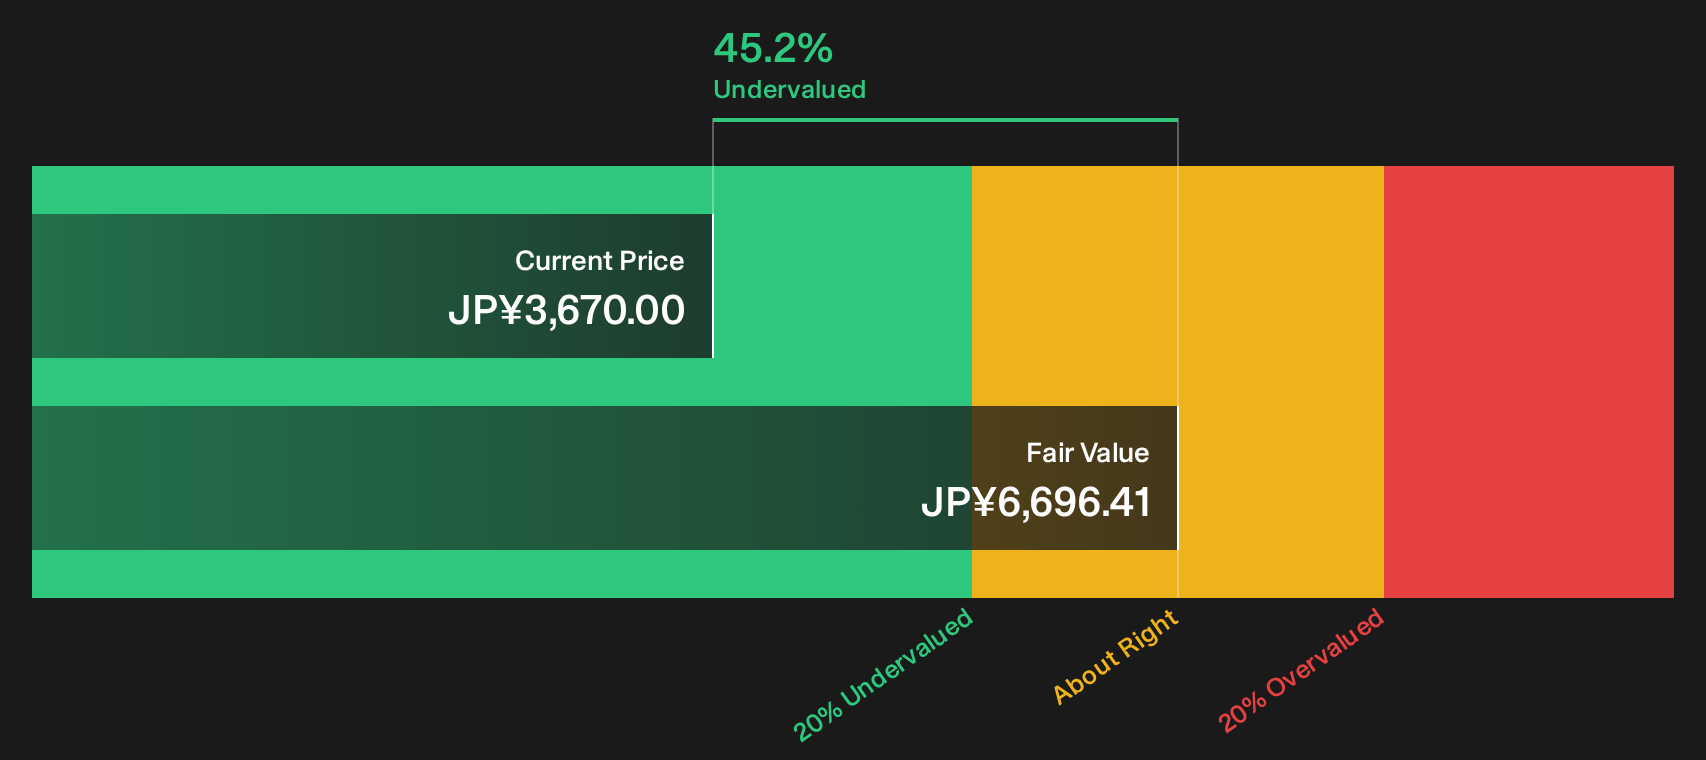
For Fujimi, a 25.8x P/E at a market value of ¥272.3b implies buyers are willing to pay a premium for its earnings stream. The SWS DCF model points to a fair value of ¥6,696.41 per share, which is 45.2% above the current price and flagged as trading below an estimate of future cash flow value.
That premium P/E looks stretched when set against the JP Chemicals industry average of 13x and a fair P/E estimate of 18.6x. Both reference points suggest the market could shift the multiple closer to those lower levels if sentiment cools or if expectations reset.
Explore the SWS fair ratio for Fujimi.
Result: Price-to-earnings of 25.8x (OVERVALUED)
Still, Fujimi’s premium P/E could unravel quickly if demand for semiconductor consumables cools faster than expected or if future earnings guidance is revised down.
Find out about the key risks to this Fujimi narrative.
Another view on Fujimi’s value
On one hand, Fujimi looks expensive on a 25.8x P/E against the JP Chemicals sector on 13x and a fair ratio of 18.6x. On the other, the SWS DCF model flags the stock as trading about 45.2% below an estimate of future cash flow value at ¥6,696.41.
Those two signals pull in opposite directions. The real question for you is which set of assumptions feels more fragile if the semiconductor cycle or Fujimi’s own guidance starts to shift.
Look into how the SWS DCF model arrives at its fair value.
Simply Wall St performs a discounted cash flow (DCF) on every stock in the world every day (check out Fujimi for example). We show the entire calculation in full. You can track the result in your watchlist or portfolio and be alerted when this changes, or use our stock screener to discover 12 high quality undervalued stocks. If you save a screener we even alert you when new companies match - so you never miss a potential opportunity.
Next Steps
Conflicted about whether Fujimi’s premium P/E and discounted DCF signal opportunity or risk, and want to move fast rather than follow the crowd? Start by weighing up the 3 key rewards and 2 important warning signs
Looking for more investment ideas beyond Fujimi?
You have a clear view on Fujimi now, so the next smart move is to widen your opportunity set before the market prices those gaps away.
- Target resilient compounding potential by reviewing companies with strong balance sheets and consistent fundamentals through the list of solid balance sheet and fundamentals (23 results).
- Hunt for mispriced quality by scanning the 12 high quality undervalued stocks that meet strict cash flow and balance sheet criteria.
- Secure income-focused opportunities by checking out 28 dividend fortresses built around higher yields and durable payout profiles.
This article by Simply Wall St is general in nature. We provide commentary based on historical data and analyst forecasts only using an unbiased methodology and our articles are not intended to be financial advice. It does not constitute a recommendation to buy or sell any stock, and does not take account of your objectives, or your financial situation. We aim to bring you long-term focused analysis driven by fundamental data. Note that our analysis may not factor in the latest price-sensitive company announcements or qualitative material. Simply Wall St has no position in any stocks mentioned.
Have feedback on this article? Concerned about the content? Get in touch with us directly. Alternatively, email editorial-team@simplywallst.com