


Ito En (TSE:2593) On Shareholder Perk Review And Why The Stock Still Looks Pricey
Ito En (TSE:2593) has drawn fresh attention after a board meeting on 29 September 2026, where directors considered abolishing the shareholder benefit program that has long appealed to many Japanese retail investors.
The policy review comes after a steadier period for Ito En's share price, with a 90 day share price return of 6.59% and a year to date gain of 2.99% at a closing price of ¥3,136 on 9 October 2026.
Compare Ito En's shift on shareholder perks with other companies reviewing investor policies by scanning our hand picked 23 resilient stocks with low risk scores, which pair steadier profiles with clearer capital return frameworks.
For Ito En, the share perk rethink lands just as the price trades above both analyst targets and some intrinsic value estimates. Is that premium justified, or has sentiment moved faster than fair value?
Price-to-Earnings of 83.8x: Is it justified?
The current valuation of Ito En looks demanding when set against its own earnings profile and peer group. At a last close of ¥3,136, the stock is described as expensive on several checks that compare its P/E to both a fair value estimate and to the broader beverage sector.
The P/E ratio of 83.8x means investors are paying just under 84 times the company’s latest earnings per share. For a consumer beverages group with steady tea and coffee brands, that is a rich multiple that usually implies the market is placing a high value on future profit growth rather than recent results.
That expectation is being placed on a business where profit margins sit at 0.9%, compared with 3.2% a year earlier, and where earnings have declined by 6.6% per year over the past 5 years and fell sharply in the last 12 months because of a ¥16.4b one off loss. In this context, the description that Ito En is expensive relative to an estimated fair P/E of 31.2x suggests a large gap between what the current earnings profile might support and what the share price implies investors are willing to pay.
The same pattern shows up when you line Ito En against its reference points. The stock is described as expensive versus the Asian Beverage industry average P/E of 16.6x and also relative to a peer group average P/E of 19.8x, which points to a much higher earnings multiple than comparable companies. If the market were to move closer to the indicated fair ratio of 31.2x, that would represent a very different valuation framework from the present 83.8x level.
Explore the SWS fair ratio for Ito En.
Result: Price-to-Earnings of 83.8x (OVERVALUED)
Still, the recent share price premium could unwind quickly if earnings momentum stalls again or if the potential loss of shareholder perks cools retail demand.
Find out about the key risks to this Ito En narrative.
Another view on Ito En's value
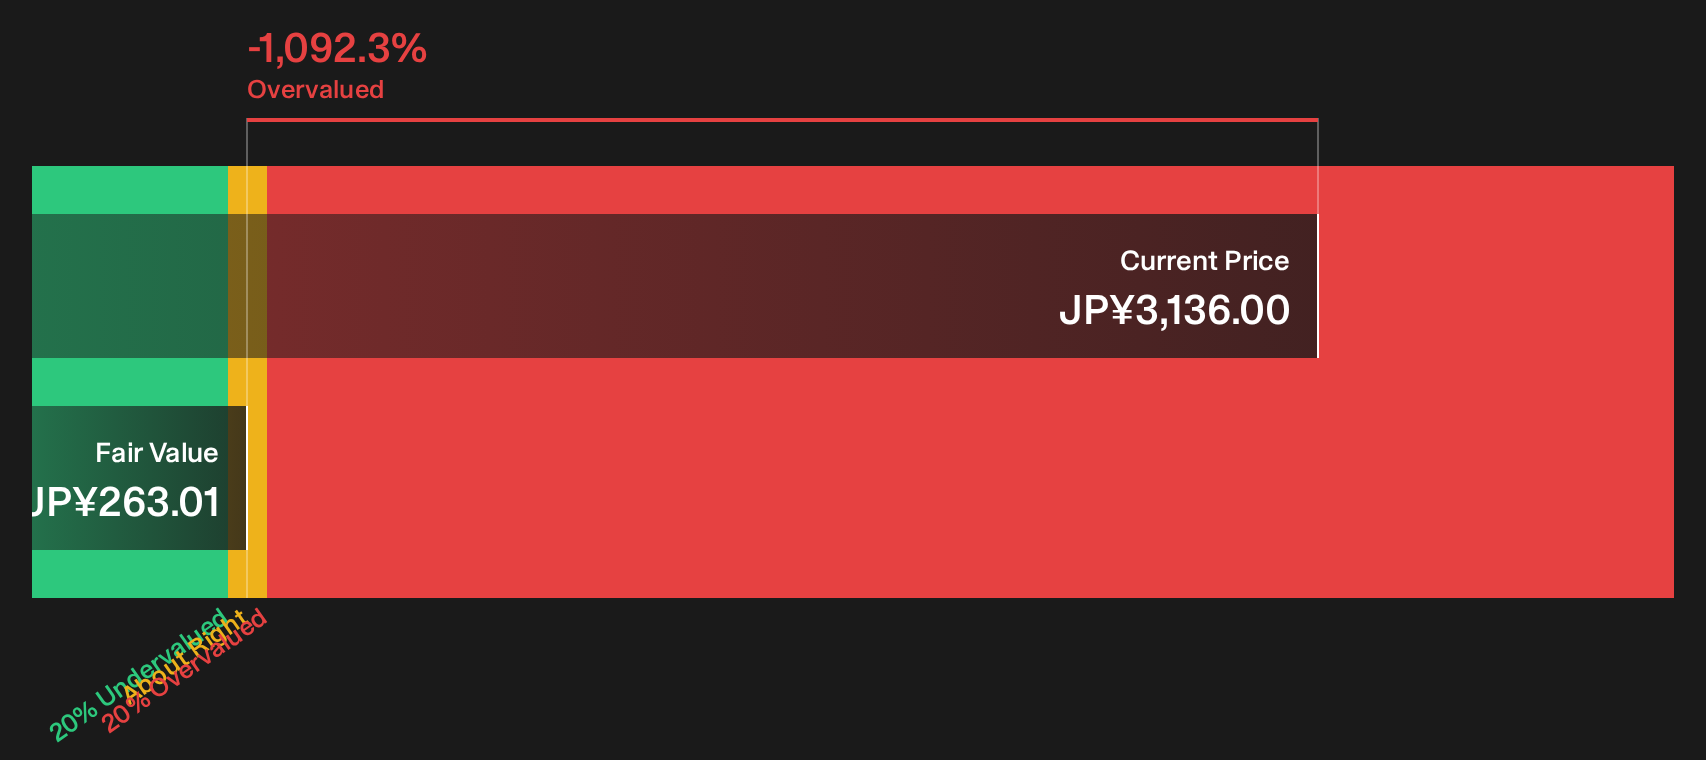
The SWS DCF model paints a far harsher picture for Ito En than the rich P/E multiple suggests. At a share price of ¥3,136, the stock is reported as trading well above an estimated future cash flow value of ¥263.01. This implies a very large premium to that cash flow based view.
This kind of gap does not automatically make the stock wrong or the model flawed. It does, however, leave you with a simple question: Is the market paying for a story that cash flows struggle to support, or is the model missing something that current buyers can already see?
Look into how the SWS DCF model arrives at its fair value.
Simply Wall St performs a discounted cash flow (DCF) on every stock in the world every day (check out Ito En for example). We show the entire calculation in full. You can track the result in your watchlist or portfolio and be alerted when this changes, or use our stock screener to discover 12 high quality undervalued stocks. If you save a screener we even alert you when new companies match - so you never miss a potential opportunity.
Next Steps
Worried the tone around Ito En is skewed too heavily to either caution or optimism? Act quickly, pull up the data, and pressure test both sides of the story against the 1 key reward and 2 important warning signs.
Looking for more Ito En investment ideas?
If Ito En feels fully priced, use this moment to widen your watchlist and let data driven filters surface opportunities you might otherwise overlook across the market.
- Target resilient balance sheets first, then branch out once you have a core of sturdier holdings found through our list of solid balance sheet and fundamentals (23 results).
- Hunt for mispriced quality where fundamentals and valuation work together by scanning the 12 high quality undervalued stocks.
- Strengthen your income stream by reviewing companies that combine higher yields with sturdier payout profiles through the 28 dividend fortresses.
This article by Simply Wall St is general in nature. We provide commentary based on historical data and analyst forecasts only using an unbiased methodology and our articles are not intended to be financial advice. It does not constitute a recommendation to buy or sell any stock, and does not take account of your objectives, or your financial situation. We aim to bring you long-term focused analysis driven by fundamental data. Note that our analysis may not factor in the latest price-sensitive company announcements or qualitative material. Simply Wall St has no position in any stocks mentioned.
Have feedback on this article? Concerned about the content? Get in touch with us directly. Alternatively, email editorial-team@simplywallst.com