


Fluxys Belgium (ENXTBR:FLUX) Following Strong First Half Earnings Faces A Valuation Test
Fluxys Belgium earnings jump puts first half of 2026 in focus
Fluxys Belgium (ENXTBR:FLUX) just posted first half 2026 results that caught investor attention, with sales of €342.97 million and net income of €46.78 million, both higher than the prior year period.
Recent trading has been mixed, with the share price gaining 1.44% over the last day and 3.41% over the past week. It is down 5.78% over 30 days, while a 10.99% year to date share price return and 16.66% 1 year total shareholder return suggest Fluxys Belgium still carries positive momentum over a longer stretch.
Scan how Fluxys Belgium compares with other regulated infrastructure players by reviewing a curated set of 43 power grid technology and infrastructure stocks that share similar grid and energy transport themes.
Fluxys Belgium has enjoyed a solid rebound over the past year, yet the latest earnings jump and current discount to analyst targets raise a simple question: Is most of the upside already booked, or is the main move still ahead?
Price-to-earnings of 16.6x for Fluxys Belgium: Is it justified?
On a simple valuation yardstick, the Fluxys Belgium share price of €21.2 translates into a P/E of 16.6x. This screens as expensive compared both with its direct peers and the wider European oil and gas group.
P/E compares the current share price to per share earnings. For a regulated infrastructure operator such as Fluxys Belgium, that ratio often reflects how investors view the stability of earnings, the predictability of future cash flows, and the balance between dividend demands and reinvestment needs.
Here, the multiple of 16.6x sits well above the European oil and gas industry average of 13.9x and also above the peer group average of 12.5x. That kind of premium means the market is paying relatively more for each euro of profit, even though debt is not well covered by operating cash flow, the dividend of 6.6% is not well covered by earnings or free cash flows, and the SWS DCF model currently points to a future cash flow value of €1.5, which is far below the current price.
The valuation gap is clear when compared with sector norms. Fluxys Belgium trades more richly than both its industry and peer averages based on P/E, while the SWS DCF model signals a large premium to its estimate of future cash flow value. As a result, the burden of proof sits with future performance to support that higher price tag.
See what the numbers say about this price — find out in our valuation breakdown.
Result: Preferred multiple of 16.6x price-to-earnings (OVERVALUED)
Still, Fluxys Belgium faces clear pressure points, including declining annual revenue and a dividend that current earnings and free cash flows do not fully support.
Find out about the key risks to this Fluxys Belgium narrative.
Another view on Fluxys Belgium’s value
The picture changes when switching from the P/E yardstick to the SWS DCF model. On that framework, Fluxys Belgium at €21.2 trades well above an estimated future cash flow value of €1.5, which implies a very rich price. Which lens do you trust more for a regulated grid operator?
Look into how the SWS DCF model arrives at its fair value.
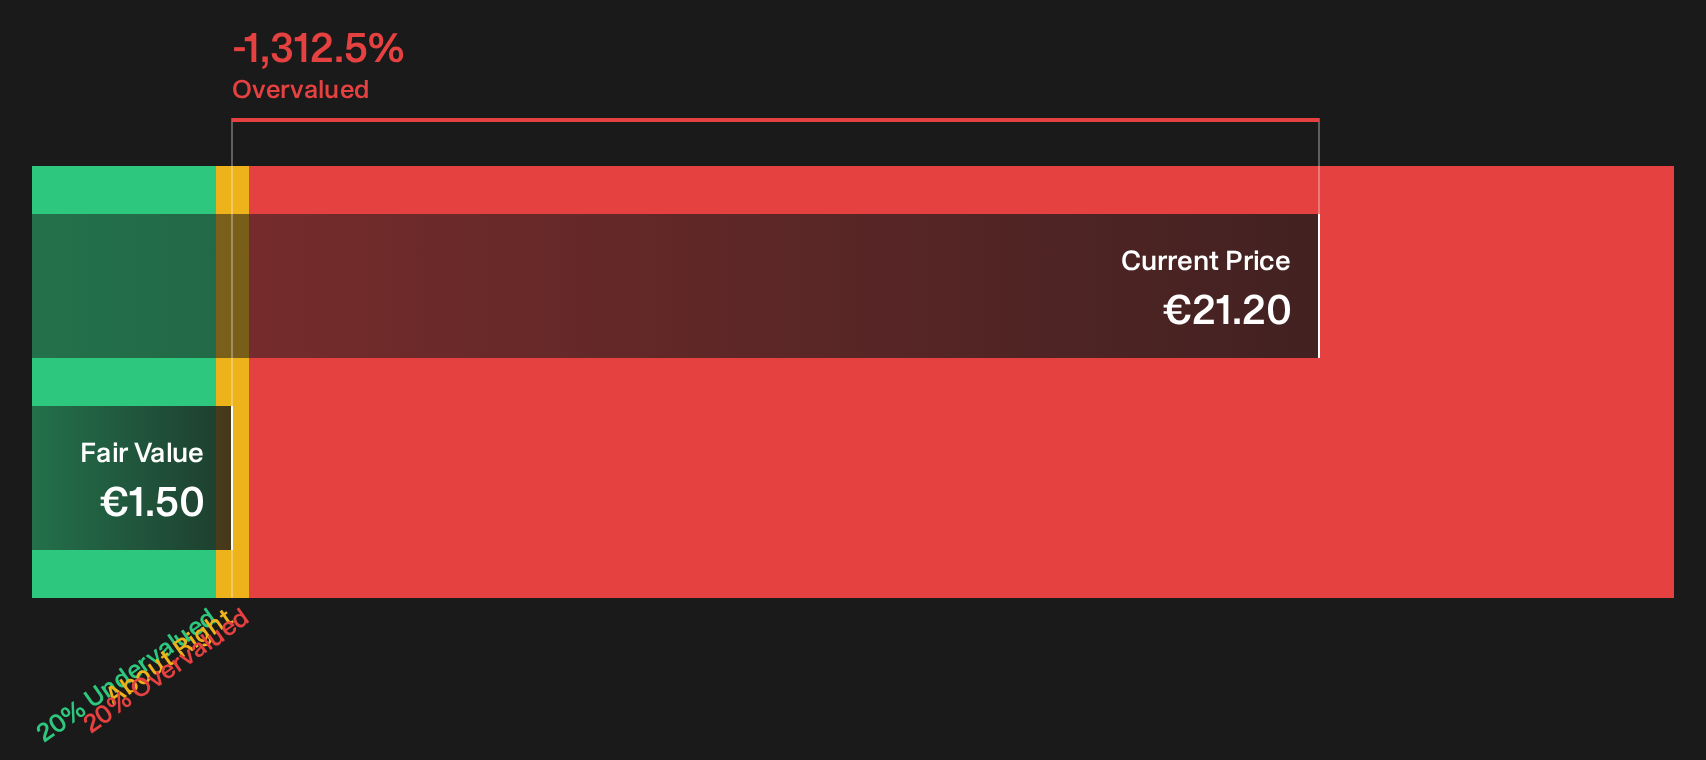
Simply Wall St performs a discounted cash flow (DCF) on every stock in the world every day (check out Fluxys Belgium for example). We show the entire calculation in full. You can track the result in your watchlist or portfolio and be alerted when this changes, or use our stock screener to discover 174 high quality undervalued stocks. If you save a screener we even alert you when new companies match - so you never miss a potential opportunity.
Next Steps
The mix of optimism and concern around Fluxys Belgium only really matters if it shapes your own decision. Take a few minutes to review the numbers, weigh both the potential upside and the flagged issues, and then drill into the 1 key reward and 2 important warning signs
Ready for more ideas beyond Fluxys Belgium?
If Fluxys Belgium has your attention, do not stop there. Broader context from other opportunities can sharpen your judgment and keep your portfolio options open.
- Spot potential value opportunities before the crowd by scanning a 174 high quality undervalued stocks tailored to strong fundamentals and reasonable pricing.
- Build a steadier income stream by reviewing a 223 dividend fortresses focused on higher yields with an emphasis on resilience.
- Reduce portfolio stress by filtering for a 222 resilient stocks with low risk scores that highlights companies with more measured risk profiles.
This article by Simply Wall St is general in nature. We provide commentary based on historical data and analyst forecasts only using an unbiased methodology and our articles are not intended to be financial advice. It does not constitute a recommendation to buy or sell any stock, and does not take account of your objectives, or your financial situation. We aim to bring you long-term focused analysis driven by fundamental data. Note that our analysis may not factor in the latest price-sensitive company announcements or qualitative material. Simply Wall St has no position in any stocks mentioned.
Have feedback on this article? Concerned about the content? Get in touch with us directly. Alternatively, email editorial-team@simplywallst.com