


BGC Group (BGC) Draws Fresh Value Attention, Is The Stock Already Pricey?
Fresh analyst coverage highlighting BGC Group (BGC) as a value rated stock, backed by a low P/E ratio and solid earnings projections, has drawn investor attention to the broker’s current pricing.
Recent trading has been mixed for BGC Group, with a 1-day share price return of 2.23% lifting the stock to US$11.48 even as the 30-day share price return declined 5.82%. That short-term softness contrasts with a 28.41% year-to-date share price return and a 1-year total shareholder return of 30.92%, alongside a 3-year total shareholder return of 102.33%. Together, these figures indicate that momentum has been building over a longer horizon as investors reassess the broker’s value rating and earnings outlook.
Scan value opportunities around BGC Group by sizing up the hand picked 28 high quality undervalued stocks that share strong fundamentals and are currently priced at a discount to their financial profile.
BGC Group has a broad, established brokerage and technology platform and a share price that has run hard over the past few years. The real question now is whether that quality is already fully reflected in today’s valuation.
Price-to-Earnings of 28.6x: Is it justified?
BGC Group looks like a value idea on some screens, yet at a P/E of 28.6x compared with a peer average of 16.1x, the stock is being valued far more richly than many close comparables even though it still trades below the broader US Capital Markets industry multiple of 39.3x.
The P/E ratio links the share price to earnings per share, so for a brokerage and technology platform like BGC Group it reflects what investors are willing to pay today for each dollar of current profit. A higher P/E often implies the market is baking in stronger durability of earnings, cleaner profitability, or a business mix that is perceived as higher quality.
Here the picture is mixed. The current 28.6x P/E is framed as good value when set against the 39.3x industry average, which suggests the market is not pricing BGC Group at the top tier of capital markets stocks despite its earnings growth track record and 14.9% return on equity. Compared with the tighter peer group on a 16.1x average though, the same multiple looks expensive and implies the market is willing to pay a clear premium relative to similar firms. See what the numbers say about this price — find out in our valuation breakdown.
Result: Price-to-Earnings of 28.6x (ABOUT RIGHT)
Still, the story around BGC Group could change quickly if trading volumes weaken or regulation alters the economics in core brokerage and technology markets.
Find out about the key risks to this BGC Group narrative.
Another View on BGC Group’s Value
The P/E comparison paints BGC Group as roughly fairly placed against the wider industry, but the SWS DCF model pushes back hard on that idea. With the share price at $11.48 and the model’s future cash flow value estimate at $3.01, the stock screens as heavily overvalued. That gap raises a simple question for investors: Which signal deserves more weight, earnings multiples or long term cash flows?
For readers who rely more on cash flow based work, it can help to see how the SWS DCF model operates in practice. Look into how the SWS DCF model arrives at its fair value.
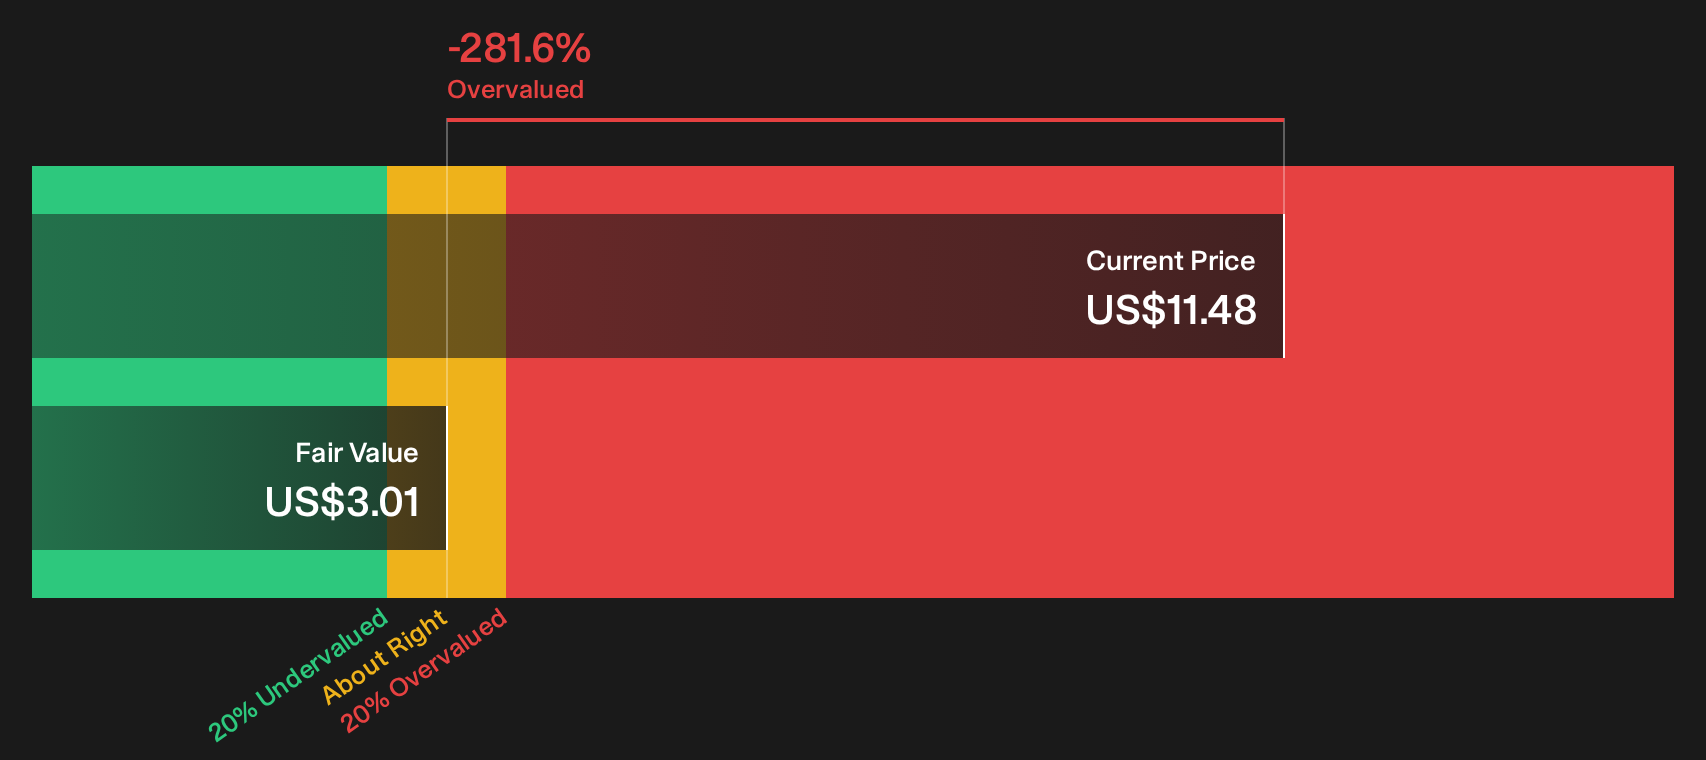
Simply Wall St performs a discounted cash flow (DCF) on every stock in the world every day (check out BGC Group for example). We show the entire calculation in full. You can track the result in your watchlist or portfolio and be alerted when this changes, or use our stock screener to discover 28 high quality undervalued stocks. If you save a screener we even alert you when new companies match - so you never miss a potential opportunity.
Next Steps
Mixed signals around BGC Group’s valuation and cash flow story can feel uneasy. Move quickly, look through the numbers for yourself, and weigh both the potential upside and the areas of concern using the 2 key rewards and 2 important warning signs
Looking for more BGC Group sized investment ideas?
If BGC Group has sharpened your focus on valuation and quality, casting a wider net with targeted screeners can surface opportunities you might otherwise overlook.
- Lock onto potential turnaround stories by scanning the 14 elite penny stocks with strong financials that already pair stronger balance sheets with more resilient financial profiles.
- Zero in on quality at a discount by reviewing the 28 high quality undervalued stocks that combine solid fundamentals with pricing that still trails their financial strength.
- Prioritise resilience and support a more defensive stance by filtering for 31 resilient stocks with low risk scores that score well on stability and balance sheet robustness.
This article by Simply Wall St is general in nature. We provide commentary based on historical data and analyst forecasts only using an unbiased methodology and our articles are not intended to be financial advice. It does not constitute a recommendation to buy or sell any stock, and does not take account of your objectives, or your financial situation. We aim to bring you long-term focused analysis driven by fundamental data. Note that our analysis may not factor in the latest price-sensitive company announcements or qualitative material. Simply Wall St has no position in any stocks mentioned.
Have feedback on this article? Concerned about the content? Get in touch with us directly. Alternatively, email editorial-team@simplywallst.com