


What RenaissanceRe Holdings Stock Slow Premium Growth Means For Shareholders
- RenaissanceRe Holdings has been flagged for stagnant net premiums and an estimated sales decline, with earnings per share growth trailing peers over the past two years.
- This slower earnings progress is putting attention on how RenaissanceRe can find new growth levers beyond its traditional underwriting engine.
- We will examine how RenaissanceRe Holdings' investment narrative is being tested by stagnant net premiums and the implied need for fresh growth drivers.
Compare RenaissanceRe Holdings with other potential low volatility ideas and see which insurers and financials are still showing momentum across our 31 resilient stocks with low risk scores today.
RenaissanceRe Holdings Investment Narrative Recap
For you to back RenaissanceRe Holdings today, you need to be comfortable with a story that leans more on underwriting quality, fee income and investment returns than on headline premium expansion. The recent flag on stagnant net premiums and an expected sales decline reinforces that top line momentum is not the main attraction near term. The key short term swing factor is whether the three driver model can offset slower written premiums.
The flip side is clear. A heavier property catastrophe book, persistent social inflation in casualty lines and a guided rise in the expense ratio toward 5.0% to 5.5% in 2026 leave RenaissanceRe more exposed if loss activity picks up or pricing weakens. The latest low volatility caution does not radically change that risk profile, but it does put execution under a brighter spotlight.
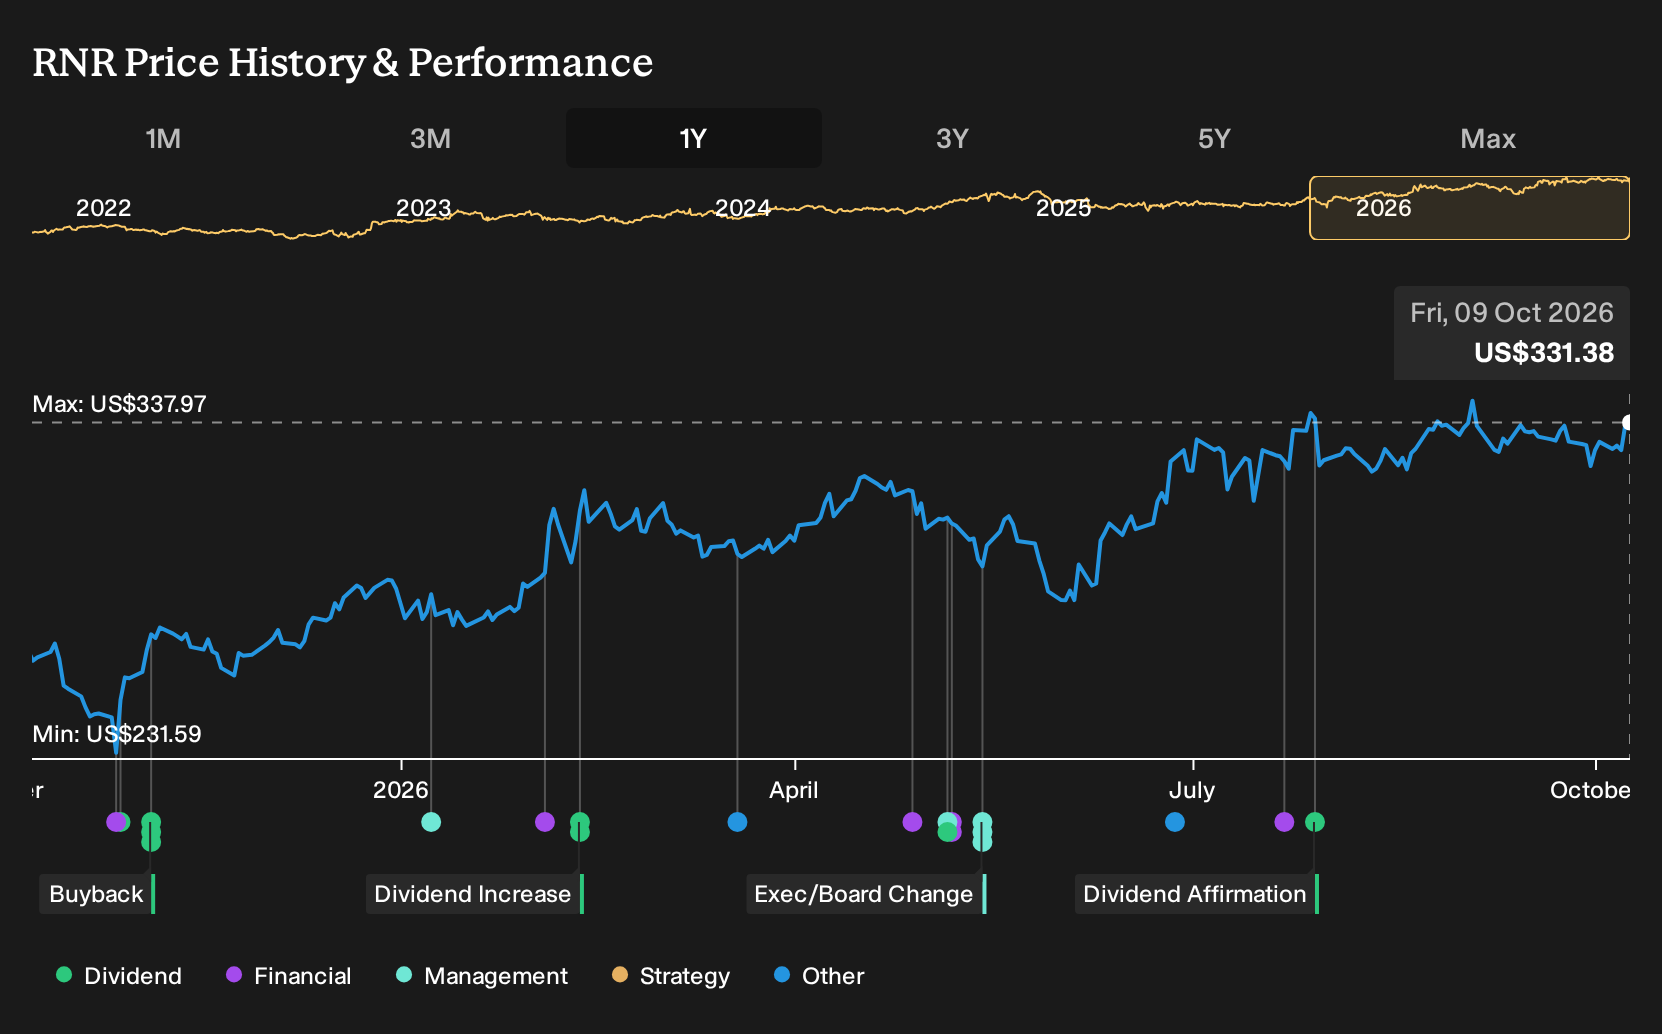
Recent commentary around RenaissanceRe Holdings highlights a valuation angle that many readers will focus on. The shares trade on a P/E of 5.4x versus an estimated fair P/E of 8x and the stock is described as around 67% below one fair value estimate based on discounted cash flows. Those figures only help if future earnings and cash flows hold up against the pressure from softer premiums.
That gap between current pricing and modelled value sits next to forecasts that revenue and earnings may decline over the next three years, with earnings expected to fall by around 18% per year. For you, the question is whether the same three driver model that supported a 20.7% return on equity and 32.2% earnings growth over the past year can offset the identified risks quickly enough for that discount to close.
RenaissanceRe Holdings Forecast Setup
RenaissanceRe Holdings' current analyst framework leans on falling revenue and shrinking profit margins over the next few years, so the assumptions behind those numbers matter as much as the outputs. Consensus expects top line to decline by 13.1% each year over the coming three years, with profit margins easing from 22.9% today to 17.7%. That combination implies a smaller profit pool being earned on a thinner spread, which puts more pressure on underwriting discipline, fee income and investment returns to keep overall profitability resilient.
On earnings, the picture in the Simply Wall St extract is straightforward but not especially generous. Analysts are forecasting that profits will move from US$2.6b today to about US$1.3b by 2029, with some expecting as much as US$1.5b. That projection means earnings would fall by roughly US$1.3b from the current base, which is a sizeable reset in absolute dollars even before thinking about what it implies for capital allocation, buybacks and dividend capacity. There is also an overlay from share count, with analysts assuming outstanding shares step down by 7% per year over the next three years. This would support earnings per share even if total net income trends lower.
The valuation extract ties all of these inputs together in a way that readers can benchmark quickly. For the analyst price targets to line up, RenaissanceRe would need to be generating US$7.3b of revenue and US$1.3b of earnings by 2029, and the stock would need to trade on a P/E of 11.0x versus about 5.3x today. That requires you to accept a world where the business is smaller on the top line than it is now but is still accorded a higher earnings multiple. This is quite a specific narrative about underwriting quality, fee stability and investment returns holding investor confidence.
RenaissanceRe Holdings' narrative projects US$7.3b revenue and US$1.3b earnings by 2029. This framework assumes revenue will decline 13.1% per year and earnings will decrease by about US$1.3b from US$2.6b today.
Uncover why RenaissanceRe Holdings' fair value indicates a 5% potential upside to its current price that may not last much longer.
Exploring Other Perspectives
One alternate view on RenaissanceRe Holdings leans heavily on catastrophe risk. The most cautious analysts had already pencilled in revenue of about US$7.1b and earnings around US$1.2b by 2029, with a lower 10.3x P/E multiple. That is a more pessimistic story than consensus, and the latest low volatility warning could push some forecasts even lower. Opinions clearly differ, so treat this as a prompt to explore several narratives before deciding how the new information fits your own expectations.
Explore 2 other RenaissanceRe Holdings fair value estimates, including one that suggests as much as 6% downside from the current price.
The Verdict Is Yours
Disagree with existing narratives? Extraordinary investment returns rarely come from following the herd, so go with your instincts.
- A great starting point for your RenaissanceRe Holdings research is our analysis highlighting 3 key rewards and 2 important warning signs that could impact your investment decision.
- See our latest analysis for RenaissanceRe Holdings. The report includes a comprehensive fundamental analysis summarized in a single visual, the Snowflake, making it easy to evaluate RenaissanceRe Holdings' overall financial health at a glance.
Looking For More Investment Ideas Beyond RenaissanceRe Holdings?
RenaissanceRe Holdings may or may not fit your criteria, so it often helps to line it up against a broader watchlist and see where risk, income and value opportunities look more compelling.
- If stability comes first for you, start with a curated group of resilient companies through the 31 resilient stocks with low risk scores so you can compare RenaissanceRe Holdings with peers that score well on consistency and downside risk.
- For readers focused on income, use the 8 dividend fortresses to scan for businesses that pair higher yields with balance sheets and cash flows that support regular payouts.
- If you want to hunt for potential mispricings, line up candidates using the 28 high quality undervalued stocks and see which stocks combine stronger fundamentals with valuations that still look modest.
This article by Simply Wall St is general in nature. We provide commentary based on historical data and analyst forecasts only using an unbiased methodology and our articles are not intended to be financial advice. It does not constitute a recommendation to buy or sell any stock, and does not take account of your objectives, or your financial situation. We aim to bring you long-term focused analysis driven by fundamental data. Note that our analysis may not factor in the latest price-sensitive company announcements or qualitative material. Simply Wall St has no position in any stocks mentioned.
Have feedback on this article? Concerned about the content? Get in touch with us directly. Alternatively, email editorial-team@simplywallst.com