


What’s Behind JNBY Design (SEHK:3306) Shares Moving Today?
Dividend approvals put JNBY Design in focus
JNBY Design (SEHK:3306) has moved into the spotlight after shareholders approved both a final dividend of HK$1.06 per share and a special dividend of HK$0.75 per share at the 2 October AGM.
JNBY Design’s dividend approvals arrive after the share price gained 16.49% over the past 30 days and 23.02% across 90 days. A 47.52% 1-year total shareholder return and very large 5-year total shareholder return suggest momentum has been building rather than fading.
Scan beyond JNBY Design and see how other Hong Kong consumer stocks with strong recent momentum and income appeal stack up in our hand picked list of 223 dividend fortresses
After that run and with JNBY Design still trading below both intrinsic estimates and analyst targets, the gap looks clear. The real issue is whether that discount reflects mispricing or justified caution on the recent momentum.
Preferred P/E of 10.2x for JNBY Design: Is it justified?
JNBY Design changes hands at a P/E of 10.2x, which sits above both its Luxury peers and an estimated fair P/E level, even though the share price is HK$22.82 and trades at a discount to some intrinsic estimates.
The P/E ratio compares the current share price with earnings per share and gives you a quick sense of how much investors are paying for each unit of profit. For a branded apparel group like JNBY Design, which earns money from multiple labels and channels, this measure often reflects what the market thinks about the durability of its income rather than just the latest headline result.
Here, the picture is mixed. Earnings quality is flagged as high, return on equity sits at 34.5%, and profit has grown both over the past year and across five years. At the same time, the 10.2x P/E is described as expensive versus the Hong Kong Luxury industry average of 7.7x, versus a peer average of 7.2x, and relative to an estimated fair P/E of 7.4x that the market could conceivably move toward if sentiment cools.
Result: Price-to-earnings of 10.2x (OVERVALUED)
Explore the SWS fair ratio for JNBY Design.
Still, JNBY Design relies heavily on Mainland China for HK$6,011.764m of its HK$6,046.259m revenue, while emerging brands contribute a smaller HK$477.512m slice.
Find out about the key risks to this JNBY Design narrative.
Another view on JNBY Design’s value
There is a split story here. On earnings, JNBY Design looks expensive at a 10.2x P/E compared with a 7.4x fair ratio and lower peer and industry averages. On cash flow, our DCF model suggests HK$22.82 trades below an estimated value of HK$31.62. Which signal should carry more weight for you right now?
Look into how the SWS DCF model arrives at its fair value.
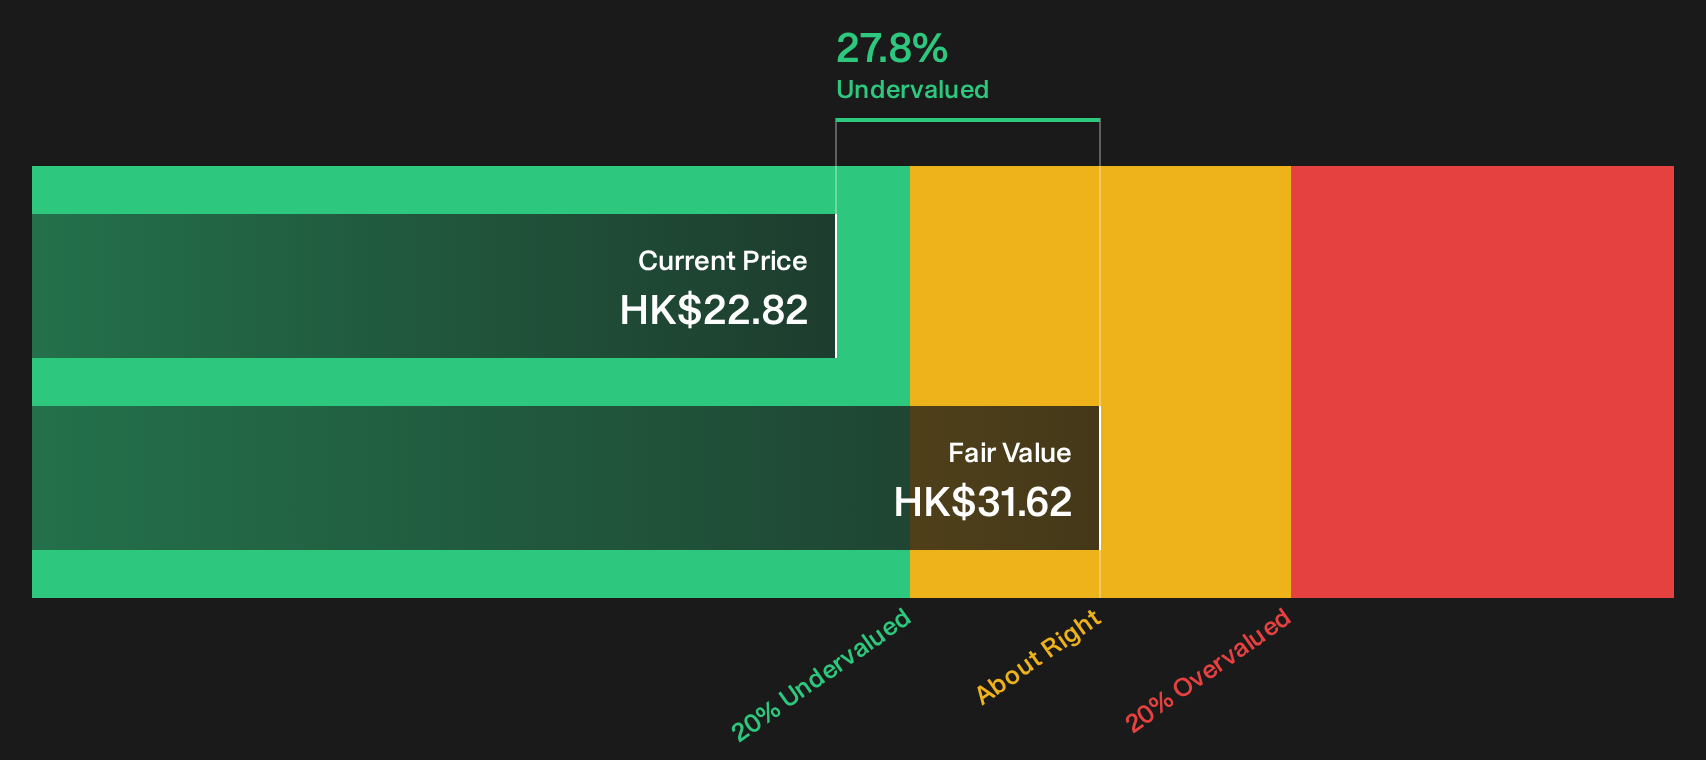
Simply Wall St performs a discounted cash flow (DCF) on every stock in the world every day (check out JNBY Design for example). We show the entire calculation in full. You can track the result in your watchlist or portfolio and be alerted when this changes, or use our stock screener to discover 174 high quality undervalued stocks. If you save a screener we even alert you when new companies match - so you never miss a potential opportunity.
Next Steps
Mixed signals or clear opportunity? If you want to move quickly and judge JNBY Design on your own terms, start by weighing its balance of 3 key rewards and 1 important warning sign.
Looking for more investment ideas beyond JNBY Design?
If JNBY Design has your attention, do not stop there. Fresh ideas often come from scanning wider markets rather than watching a single ticker.
- Spot potential mispricing early by reviewing our hand picked pool of 174 high quality undervalued stocks that combine quality fundamentals with appealing valuations.
- Strengthen your defensive side by checking companies in the list of solid balance sheet and fundamentals (204 results) before capital rushes to those stronger financial profiles.
- Get ahead of the crowd by scanning the 618 high quality undiscovered gems that pair robust metrics with lower visibility on the market radar.
This article by Simply Wall St is general in nature. We provide commentary based on historical data and analyst forecasts only using an unbiased methodology and our articles are not intended to be financial advice. It does not constitute a recommendation to buy or sell any stock, and does not take account of your objectives, or your financial situation. We aim to bring you long-term focused analysis driven by fundamental data. Note that our analysis may not factor in the latest price-sensitive company announcements or qualitative material. Simply Wall St has no position in any stocks mentioned.
Have feedback on this article? Concerned about the content? Get in touch with us directly. Alternatively, email editorial-team@simplywallst.com