


Is NGK (TSE:5333) Fully Valued Following Its Recent Pullback?
NGK (TSE:5333) has drawn fresh attention after its recent pricing left the stock down about 5% on the day, despite sizable year to date and 1 year total returns.
That single day drop sits against a much stronger backdrop for NGK, with a 30 day share price return of 11.64% and a 64.28% year to date gain. The 1 year total shareholder return of 121.12% points to momentum that has cooled recently after a weaker 90 day stretch.
Look beyond NGK's recent surge and pullback by reviewing a hand picked group of resilient industrials in the list of solid balance sheet and fundamentals (23 results) that may offer similar quality with different risk profiles.
After a 1 year total return above 100% and a sharp single day drop, NGK now sits in a more complicated spot for fresh capital. Is the current valuation enough to justify the risks involved?
Price-to-Earnings of 22.1x: Is it justified?
NGK now trades on a P/E of 22.1x, which puts a relatively rich tag on the ¥5,610 share price compared with several valuation checks.
The P/E ratio compares what investors pay today with each unit of current earnings. For an established industrial group like NGK, that gauge often reflects how much confidence the market has in the profit outlook rather than just the latest set of results.
Here, the market is assigning a meaningfully higher multiple than several benchmarks. NGK's P/E of 22.1x is above the estimated fair P/E of 21.8x, above the peer average of 17.7x, and above the broader JP Machinery industry average of 13.7x. This points to investors accepting a premium price that could compress if expectations change.
Explore the SWS fair ratio for NGK.
Result: Price-to-Earnings of 22.1x (OVERVALUED)
Still, any slip in NGK's earnings momentum or a reset in market optimism toward industrials could quickly challenge that premium P/E narrative.
Find out about the key risks to this NGK narrative.
Another View on NGK's valuation
There is a second lens that points in a similar direction as the P/E story. Our DCF model estimates the value of NGK's future cash flows at ¥4,595.48 per share, which is below the current ¥5,610 price and indicates potential overvaluation based on this approach. How much weight do you place on a cash flow model compared with market momentum?
Look into how the SWS DCF model arrives at its fair value.
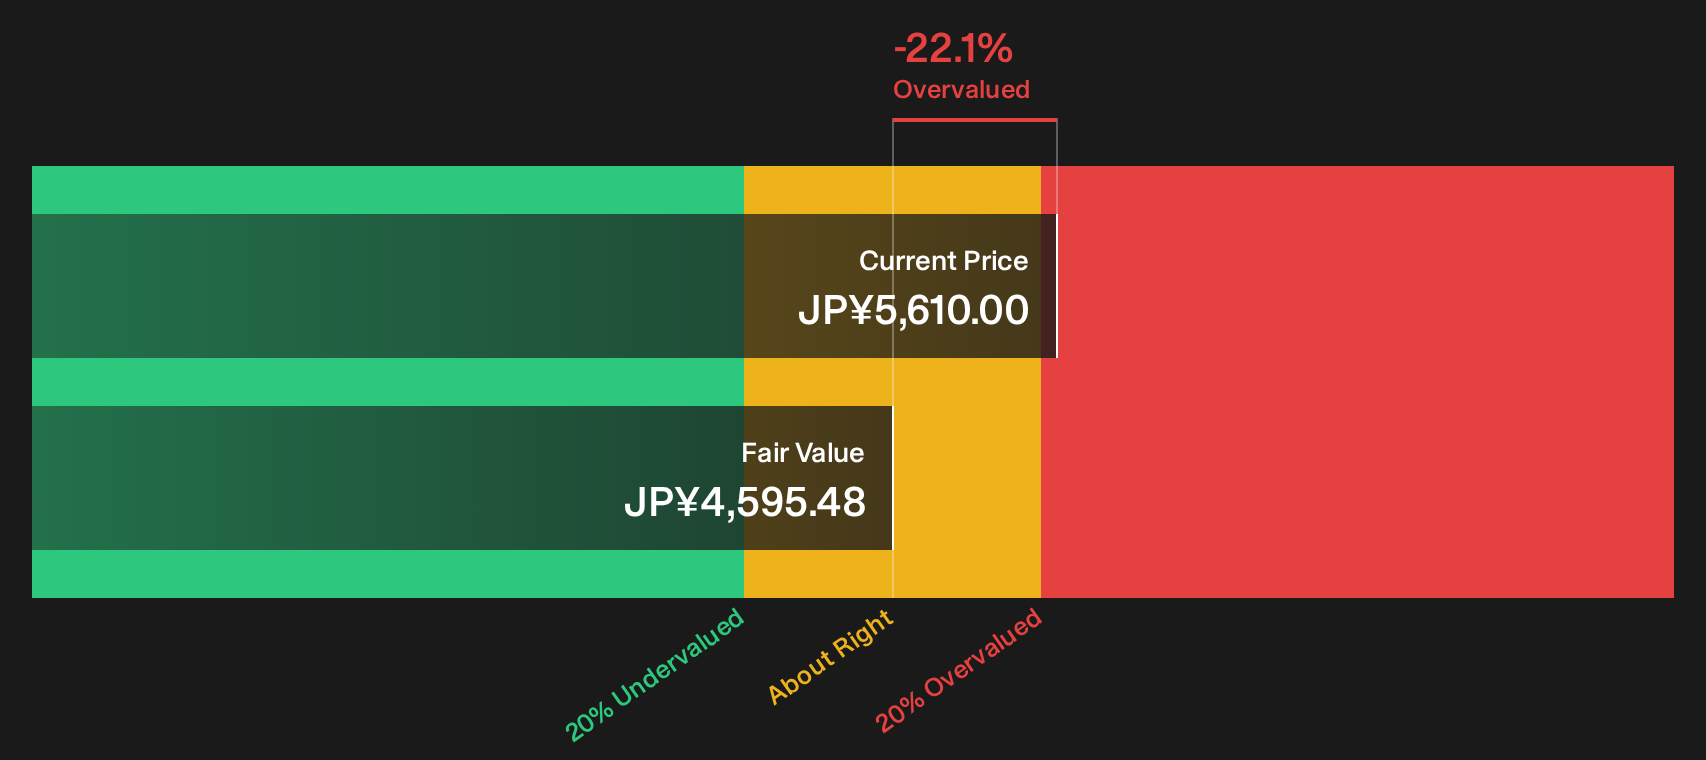
Simply Wall St performs a discounted cash flow (DCF) on every stock in the world every day (check out NGK for example). We show the entire calculation in full. You can track the result in your watchlist or portfolio and be alerted when this changes, or use our stock screener to discover 14 high quality undervalued stocks. If you save a screener we even alert you when new companies match - so you never miss a potential opportunity.
Next Steps
Mixed signals around NGK's premium valuation and recent price swings can feel messy, so move fast, pull up the data, and pressure test your own thesis using the 2 key rewards and 2 important warning signs
Looking for more NGK sized opportunities?
If NGK has you rethinking what is possible in your portfolio, do not stop at one idea. Cast the net wider with focused stock shortlists built from objective data.
- Target potential upside with companies that look mispriced on fundamentals by scanning the 14 high quality undervalued stocks.
- Strengthen your income stream by reviewing the 32 dividend fortresses that aim to pair higher yields with resilience.
- Dial down portfolio stress by weighing candidates in the 22 resilient stocks with low risk scores that screen well on financial strength and stability.
This article by Simply Wall St is general in nature. We provide commentary based on historical data and analyst forecasts only using an unbiased methodology and our articles are not intended to be financial advice. It does not constitute a recommendation to buy or sell any stock, and does not take account of your objectives, or your financial situation. We aim to bring you long-term focused analysis driven by fundamental data. Note that our analysis may not factor in the latest price-sensitive company announcements or qualitative material. Simply Wall St has no position in any stocks mentioned.
Have feedback on this article? Concerned about the content? Get in touch with us directly. Alternatively, email editorial-team@simplywallst.com