


NOF (TSE:4403) Could Be 29% Undervalued Following Its Recent Pullback
NOF (TSE:4403) is back on investor screens after a recent pullback, with the share price near ¥2,539 following declines over the past month and past 3 months that contrast with stronger multi-year returns.
Recent trading suggests momentum has cooled. The share price return is down over the past quarter and year to date, while the 3 year and 5 year total shareholder returns remain positive. The latest weakness therefore points to a reset in expectations rather than a broken long term story for NOF.
Look beyond NOF's recent pullback and see how other materials and industrials stocks with stronger balance sheets and fundamentals are setting up in our hand picked list of solid balance sheet and fundamentals (23 results).
NOF now trades well below analyst targets after a double digit pullback this year, which raises a simple issue for investors: Is most of the opportunity still in front of the stock or already in the rearview mirror as the valuation shifts?
Preferred P/E of 14.3x for NOF: Is it justified?
On a simple earnings lens, NOF trades on a P/E of 14.3x, which screens as good value against both its own fair ratio and analyst estimates that sit above the current ¥2,539 share price.
The P/E ratio compares the current share price with earnings per share, so it tells you how much investors are paying for each unit of profit. For a chemicals group like NOF, this is a useful shorthand for how the market weighs steady profit growth, capital intensity, and the inherent cyclicality in parts of the materials space.
Analysts see the stock as trading at 28.8% below an estimated fair value, and the fair P/E ratio is flagged at 14.7x, slightly higher than the current 14.3x multiple. That points to the market pricing earnings a little more cautiously than the regression based fair ratio. This is a level that some investors may expect to draw closer if current profit quality and dividend reliability at 2.76% hold up.
Compared with the JP Chemicals industry average P/E of 13x, NOF carries a premium, which signals investors are willing to pay more for each yen of earnings than they do for the typical sector peer. That premium sits alongside the relatively small gap to the 14.7x fair P/E. This combination may be interpreted by some investors as leaving scope for the current valuation multiple to move toward that fair level if the investment case continues to reflect steady earnings and balance sheet characteristics already captured in the model.
Explore the SWS fair ratio for NOF.
Result: Price-to-earnings of 14.3x (UNDERVALUED).
Still, the recent decline of 15.4% year to date and the 0.9% dip over 1 year highlight how any slip in earnings quality or balance sheet strength could quickly challenge the current NOF valuation story.
Find out about the key risks to this NOF narrative.
Another view on NOF using the SWS DCF model
The picture shifts once the SWS DCF model is put beside that 14.3x P/E. On this framework, NOF at ¥2,539 sits below an estimated future cash flow value of ¥3,564.38, which implies the stock screens as undervalued on cash generation as well as earnings.
For an investor weighing these signals, the question is simple. Is the gap between price and the SWS DCF output offering a margin of safety, or does it reflect concern that future cash flows may not fully match the current model assumptions?
Look into how the SWS DCF model arrives at its fair value.
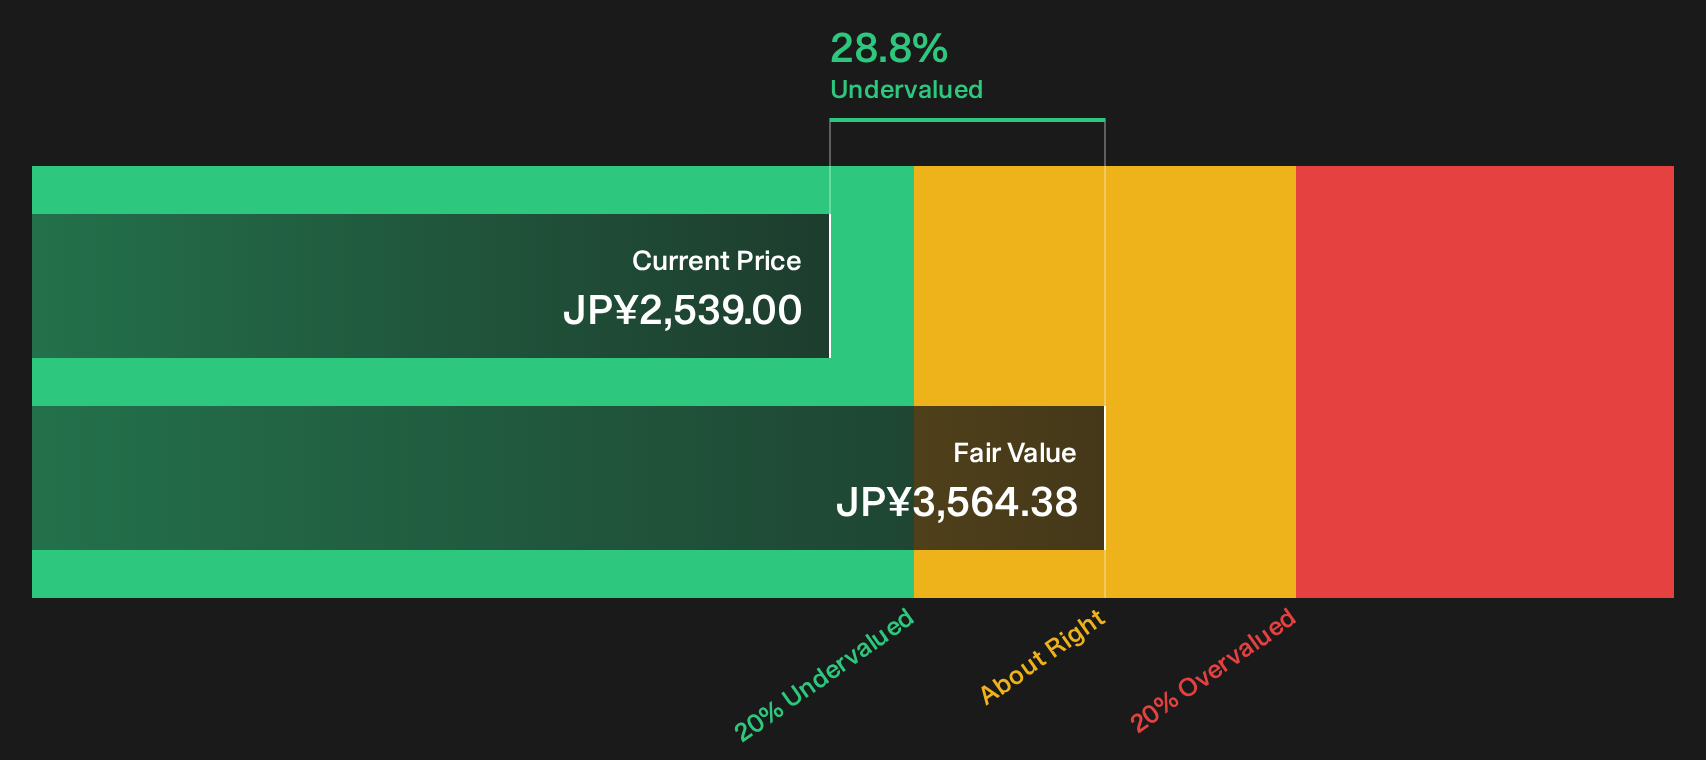
Simply Wall St performs a discounted cash flow (DCF) on every stock in the world every day (check out NOF for example). We show the entire calculation in full. You can track the result in your watchlist or portfolio and be alerted when this changes, or use our stock screener to discover 14 high quality undervalued stocks. If you save a screener we even alert you when new companies match - so you never miss a potential opportunity.
Next Steps
Sentiment around NOF is mixed after the pullback. This makes it a useful moment to test the numbers yourself instead of relying on headlines. If you want to see exactly what the optimism is built on, take a closer look at the 5 key rewards.
Looking for more investment ideas beyond NOF?
Do not stop your research with NOF. Let the numbers guide you toward other opportunities where fundamentals, balance sheet strength, and income potential all work in your favour.
- Target resilient income streams by scanning companies that feature 32 dividend fortresses and assess whether their payouts match your cash flow goals.
- Hunt for mispriced quality by reviewing the 14 high quality undervalued stocks and see which businesses combine fundamentals with room for a potential re rating.
- Sharpen your downside protection by focusing on the 22 resilient stocks with low risk scores so you are not the last to react when conditions change.
This article by Simply Wall St is general in nature. We provide commentary based on historical data and analyst forecasts only using an unbiased methodology and our articles are not intended to be financial advice. It does not constitute a recommendation to buy or sell any stock, and does not take account of your objectives, or your financial situation. We aim to bring you long-term focused analysis driven by fundamental data. Note that our analysis may not factor in the latest price-sensitive company announcements or qualitative material. Simply Wall St has no position in any stocks mentioned.
Have feedback on this article? Concerned about the content? Get in touch with us directly. Alternatively, email editorial-team@simplywallst.com